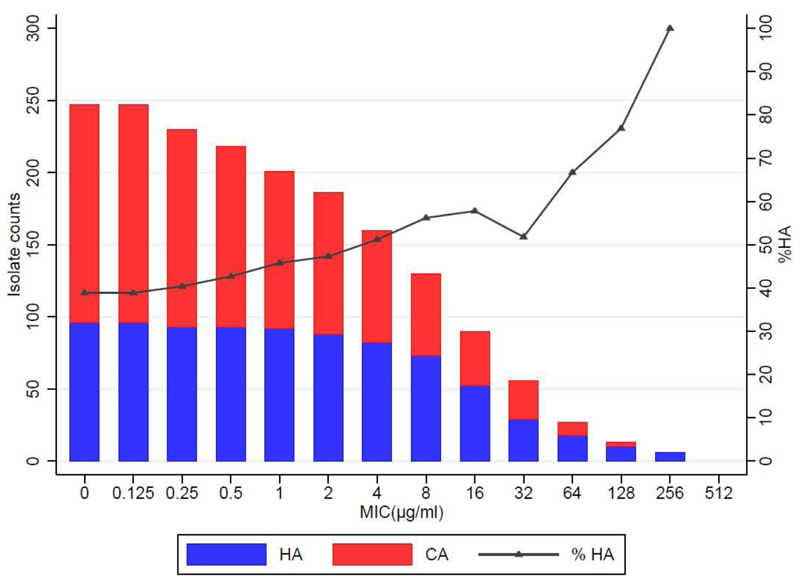
Figure 1. Frequency histogram showing the number of isolates exhibiting growth at each fosfomycin agar dilution concentration level, identifying those classified as sensitive.
(MIC≤32μg/mL for Enterobacteriaceae, or ECOFF <128μg/mL for Pseudomonas spp.)
CA = Community-acquired
HA = Hospital-acquired

