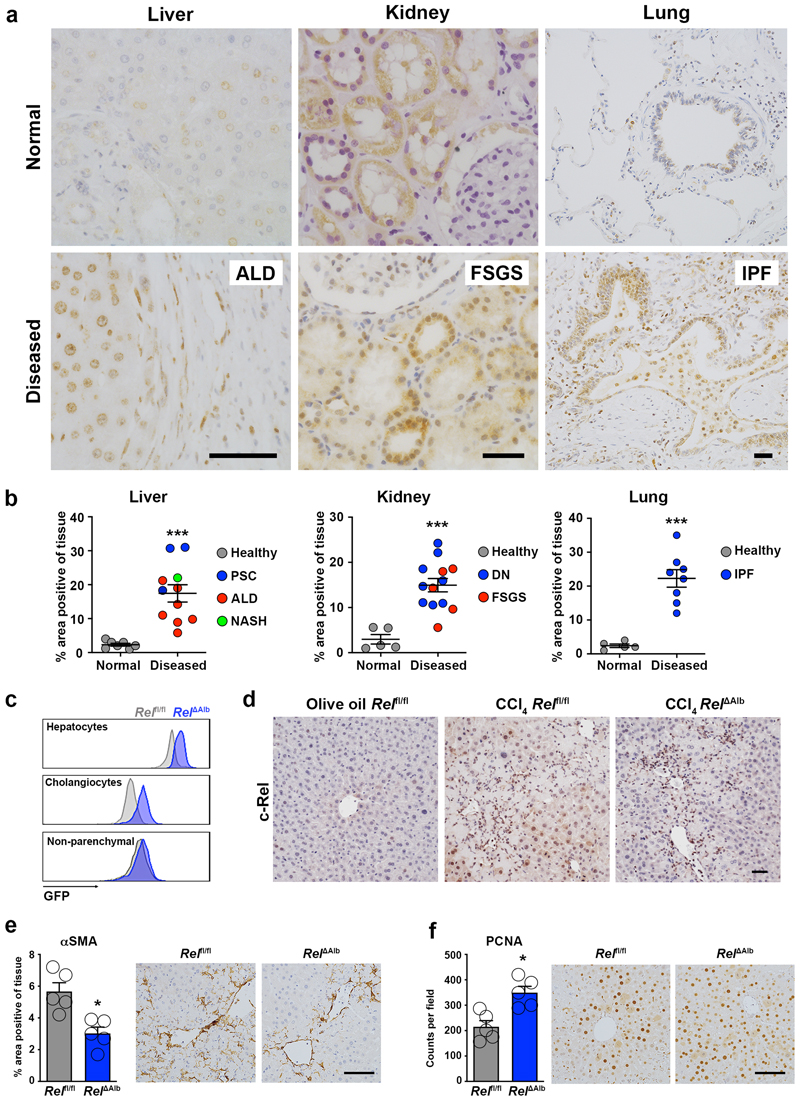
Figure 1. c-Rel is a feature of chronic liver, kidney and lung disease in humans and epithelial c-Rel signalling regulates hepatic fibrogenesis and regeneration in mice.
(a) Representative images show c-Rel staining in normal and diseased liver, lung and kidney sections. (b) Graphs show average percentage area of c-Rel stained tissue in normal liver, lung and kidney sections compared to diseased human liver (alcoholic liver disease (ALD), primary sclerosing cholangitis (PSC) and non-alcoholic steatohepatitis (NASH)), diseased kidney (focal segmented glomerular sclerosis (FSGS) and diabetic nephropathy (DN)) or lung disease, idiopathic pulmonary fibrosis (IPF). Data are mean ± s.e.m. in 7 healthy and 11 diseased patient tissue for liver (p value = 0.0003), 5 healthy and 13 diseased patient tissue for kidney (p value = 0.0002) and 5 healthy and 8 diseased patient tissue for lung (p value <0.0001). (c) FACS plot showing the Mean Fluorescence Intensity (MFI) of GFP in hepatocytes, cholangiocytes (EPCAM+) and non-parenchymal (EpCAM-) cells from the liver of Rel flfl (grey) and Rel ΔAlb (blue) mice. (d) Representative images show c-Rel staining 5 mice/group in olive oil Rel flfl mice and CCl4 injured Relflfl and Rel ΔAlb mice. (e-f) Histological assessment and representative images of (e) αSMA (p value = 0.005) and (f) PCNA (p value = 0.005) stained liver sections in acute CCl4 injured Relflfl and Rel ΔAlb mice. Data are mean ± s.e.m. in 5 mice/group. Scale bars equal 50 microns. All P values were calculated using a unpaired two-sided T test (* P <0.05, *** P <0.001).

