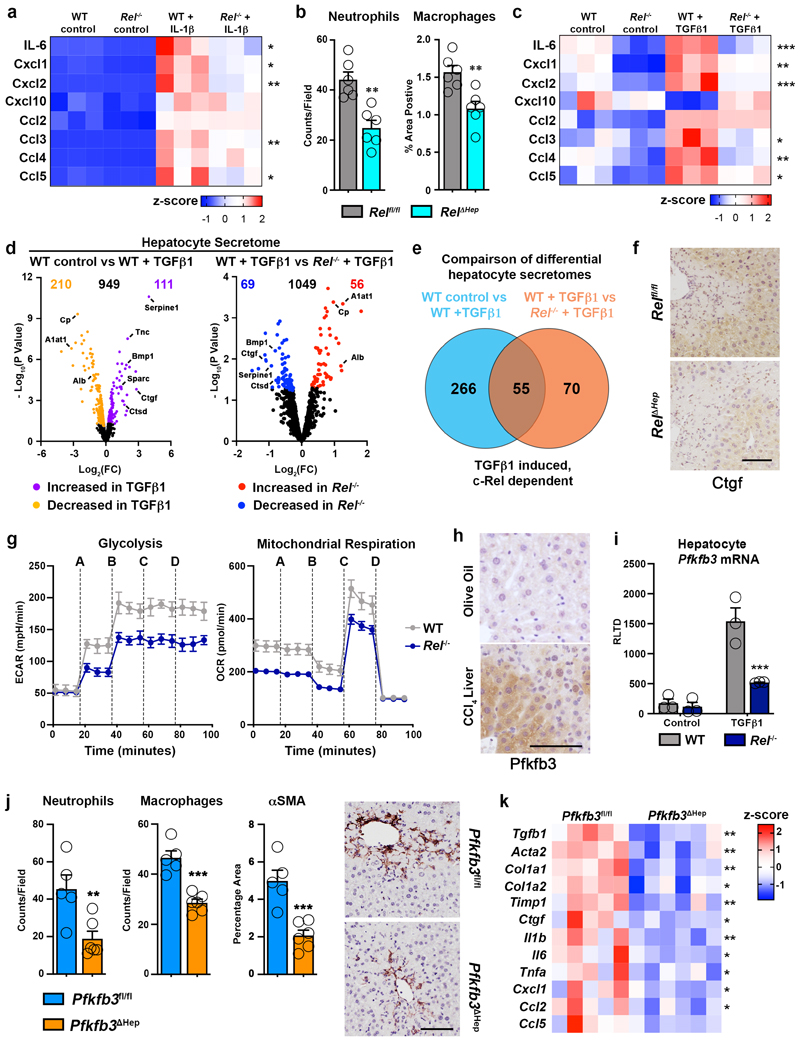
Figure 2. c-Rel signalling regulates epithelial inflammatory responses via regulation of Pfkfb3.
(a) Heatmap showing secreated IL6, Cxcl1, Cxcl2, Cxcl10, Ccl2, Ccl3, Ccl4 and Ccl5, measured by MSD in the media of hepatocytes isolated from WT and Rel-/- mice and stimulated ± IL-1β. (b) Graph shows quantification of neutrophil (p value = 0.0012) and macrophage (p value = 0.0039) numbers in the liver of acute CCl4 injured Relflfl and Rel ΔHep mice. (c) Heatmap showing secreated IL6, Cxcl1, Cxcl2, Cxcl10, Ccl2, Ccl3, Ccl4 and Ccl5, measured by MSD in the media of hepatocytes isolated from WT and Rel-/- mice and stimulated ± TGFβ1. (d) Volcano plots show differentially expressed proteins detected by proteomic analysis of the secretome of WT control and WT TGFβ1 treated hepatocytes (left) and TGFβ1 treated WT and Rel-/- hepatocytes (right). (e) Venn diagram shows the number of differentially expressed proteins in TGFβ1 treated WT hepatocytes compared to control WT hepatocytes (Blue) and number of differentially expressed proteins in TGFβ1 treated WT hepatocytes compared to TGFβ1 treated Rel-/- hepatocytes (Orange). The overlap denotes c-Rel dependent secreted proteins in response to TGFβ1 stimulation. (f) Representative images show CTGF staining in the liver of 6 mice/group acute CCl4 injured Relflfl and Rel ΔHep mice. (g) Graphs show seahorse analysis of glycolysis (extracellular acidification rate, ECAR) and mitochondrial respiration (oxygen consumption rate, OCR) in WT and Rel-/- hepatocytes stimulated ± TGFβ1. Where A-D vertical lines refer to the administration of the following compounds: A – Glucose, B – Oligomycin, C- Pyruvate and FCCP, D – Rotenone and Antimycin A. (h) Representative images show Pfkfb3 staining in a minimum of 5 mice/group of olive oil control and CCl4 injured liver. (i) Graph shows mRNA expression of Pfkfb3 in WT and Rel-/- hepatocytes stimulated ± TGFβ1. (p value = 0.0008) (j) Quantification of neutrophil (p value= 0.0097) and macrophage (p value = 0.0002) numbers and histological assessment and representative images of αSMA (p value = 0.001) stained liver sections in acute CCl4 injured Pfkfb3flfl and Pfkfb3 Δhep mice. P values were calculated using a unpaired two-sided T test. (k) Heatmap shows mRNA levels of fibrogenic genes; Tgfb1, Acta2, Col1a1, Col1a2, Timp1, Ctgf and inflammatory genes; Il1b, Il6, Tnfa, Cxcl1, Ccl2 and Ccl5 in acute CCl4 injured Pfkfb3flfl and Pfkfb3 Δhep mice. Data in graphs are mean ± s.e.m. in 7 mice/genotype (c), n=5 Pfkfb3flfl and n=6 Pfkfb3 Δhep mice (e), or a minimum of 3 independent cell isolations/condition. Scale bars equal 100 microns. (a, c, i) P values were calculated using a two-way ANOVA with Tukey post-hoc t-test. (b, j, k) P values were calculated using unpaired two-tailed T-test (* P <0.05, ** P <0.01 and ***P<0.001).

