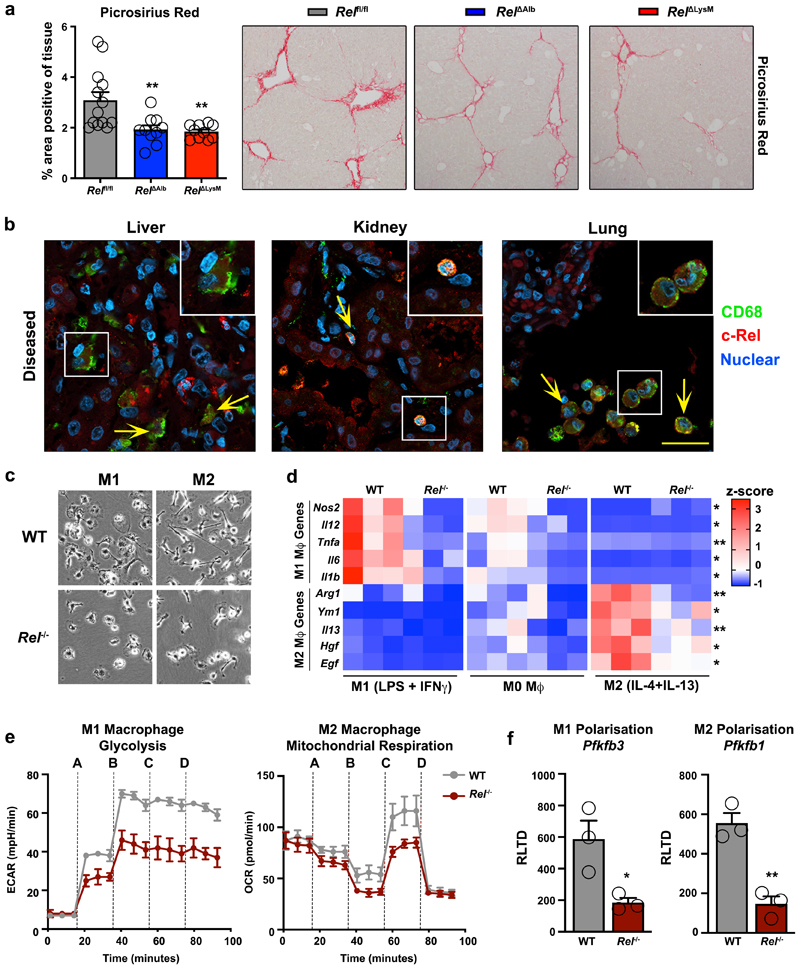
Figure 3. c-Rel signalling in macrophages is pro-fibrogenic and regulates macrophage plasticity.
(a) Histological assessment and representative images of Picrosirius red (collagen) stained liver sections in chronic CCl4 injured in Relflfl, RelΔAlb (p value = 0.0064 ) and RelΔLysM (p value = 0.0035) mice. Data are mean ± s.e.m. in 10 mice/group, scale bar equals 100 microns. (b) Representative immuno-fluorescence images show c-Rel (red), CD68 (green) and nuclear (blue) staining in human diseased liver (n=11), kidney (n=13) and lung (n=8) sections. Yellow arrows denote co-localisaton of c-Rel and CD68. Scale bars equal 20 microns. (c) Representative bright-field images of WT and Rel-/- M1 and M2 polarised BMDMs in 3 independent cell isolations. Scale bar = 50 microns (d) Heat map shows mRNA expression of Nos2, Il12, Tnfa, Il6, Il1b, Arg1, Ym1, Il13, Hgf and Egf in M0, M1 and M2 polarised WT and Rel-/- BMDM respectively. (e) Graphs show glycolysis (extracellular acidification rate, ECAR) and mitochondrial respiration (oxygen consumption rate, OCR) in M1 and M2 polarised WT and Rel-/- BMDM respectively. Where A-D vertical lines refer to the administration of the following compounds: A – Glucose, B – Oligomycin, C- Pyruvate and FCCP, D – Rotenone and Antimycin A (f) Graphs show mRNA expression of Pfkfb3 (p value = 0.029) and Pfkfb1 (p value = 0.0031) in M1 and M2 polarised WT and Rel-/- BMDMs. Data are mean ± s.e.m of n=3 independent cell isolations. (a, d) P values were calculated using a two-way ANOVA with Tukey post-hoc t-test. (f) P values calculated using an unpaired two-side T test. P values equal *P<0.05 and **P<0.01. Asterisks on heatmaps denote significance between WT and Rel -/- macrophages in M1 or M2 responsive genes in line with the M1 or M2 stimulation. There is no significant difference between M0 macrphages from either genotype.

