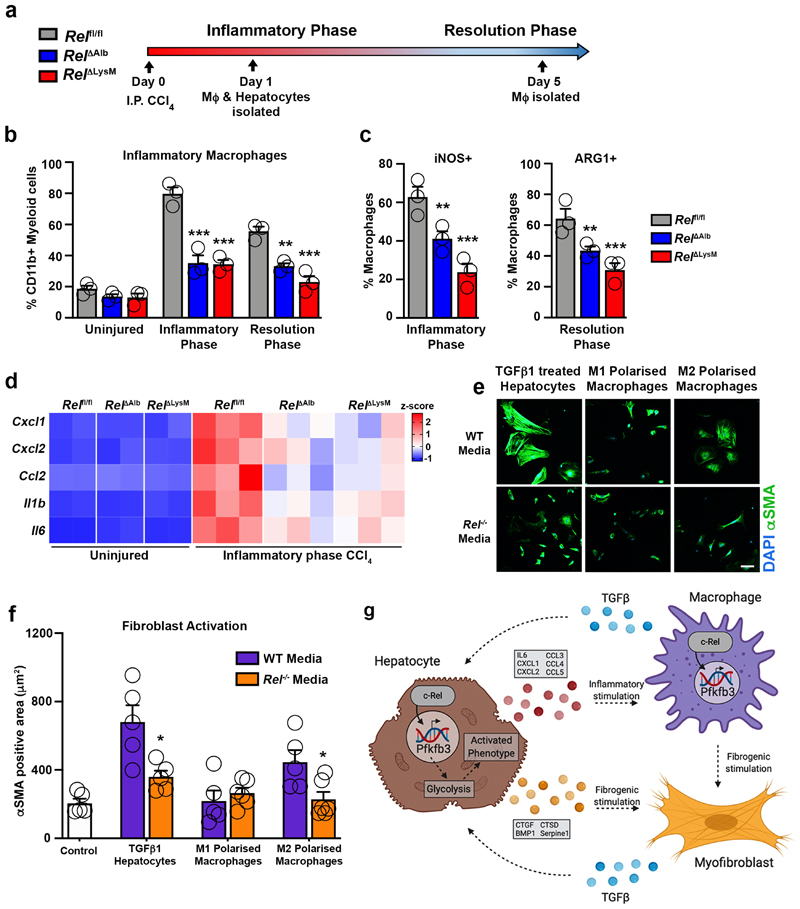
Figure 4. c-Rel regulates pro-fibrogenic epithelial-macrophage crosstalk to accelerates fibroblast activation.
(a) Schematic shows Rel fl/fl, Rel ΔLysM and Rel ΔAlb mice receiving CCl4 mediated acute liver injury. Mice were harvested at day 1 and day 5 post CCl4 injury during the inflammatory and resolution phases of wound healing (WH) respectively. (b) FACS quantification of the percentage (%) of CD11bHiF4/80Int inflammatory macrophages in uninjured liver and during the inflammatory (day 1) (p values = 0.0002 for Rel ΔAlb and 0.00012 Rel ΔLysM mice) and resolution (day 5) (p values = 0.0037 for Rel ΔAlb and 0.0002 Rel ΔLysM mice) phases of WH in acute CCl4 injured Rel flfl,Rel ΔAlb and Rel ΔLysM mice. (c) FACS quantification of the percentage (%) of iNOS+ (p values = 0.0033 for Rel ΔAlb and 0.0002 Rel ΔLysM mice) and ARG1+ (p values = 0.0043 for Rel ΔAlb and 0.0001 Rel ΔLysM mice) inflammatory macrophages during the inflammatory and resolution phases of WH respectively in acute CCl4 injured Rel flfl, Rel ΔLysM and Rel ΔAlb mice. Data in graphs are mean ± s.e.m of n=4 independent cell isolations. (d) Heatmap shows mRNA expression of inflammatory genes; Cxcl1, Cxcl2, Ccl2, Il1b and Il6 in primary hepatocytes isolated from Rel flfl, Rel ΔLysM and Rel ΔAlb mice during the inflammatory phase of WH. (e) Representative immuno-fluorescence images of αSMA (green) and nuclear (blue) staining, scale bar = 50 microns. (f) Graph showing quantification of αSMA stained area (f) in WT hepatic stellate cells cultured in media only (control) or conditioned media from WT or Rel-/- hepatocytes treated ± TGFβ1 (p value = 0.0153) or WT or Rel-/- M1 and M2 (p value = 0.024) polarised macrophages. Data are mean ± s.e.m of n=3 independent cell isolations. (b, c, f) P values were calculated using a two-way ANOVA with Tukey post-hoc t-test or an unpaired two-tailed t-test (* P <0.05, ** P <0.01 and *** P <0.001). (g) Model shows c-Rel-Pfkfb3 dependent paracrine epithelial-macrophage crosstalk driving fibroblast activation within the fibrogenic niche. Model created using biorender.

