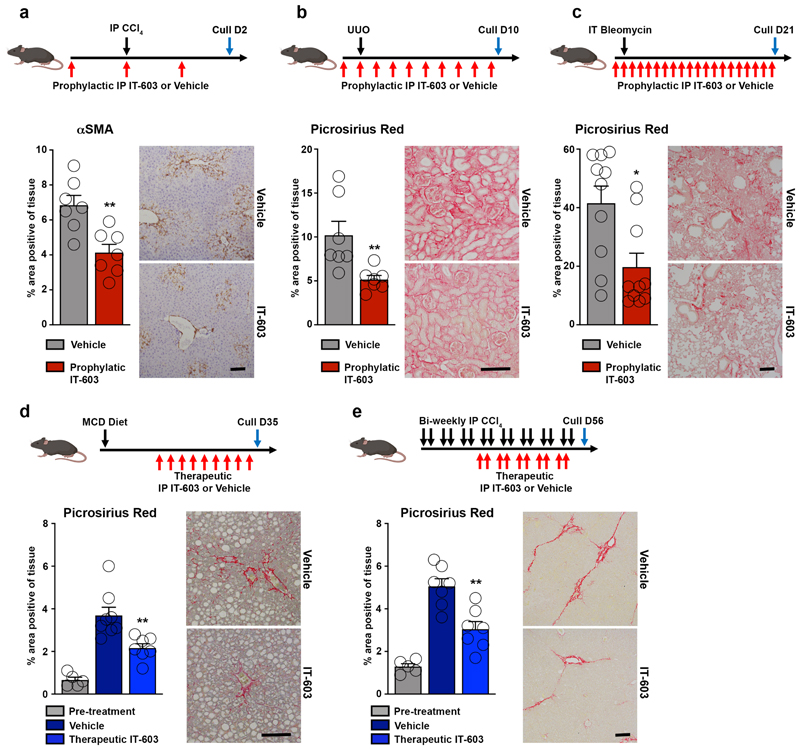
Figure 7. Pharmacological inhibition of c-Rel limits fibrogenesis in murine models of liver, kidney and lung injury.
(a-c) Diagrams show experimental timelines of CCl4, UUO or bleomycin induced liver, kidney or lung fibrosis ± prophylactic IT-603 (c-Rel inhibitor) therapy. Histological quantification and representative images of αSMA stained liver (p value = 0.0031) and Picrosirius red stained kidney (p value = 0.0099) or lungs (p value = 0.01) following their respective injury. Data are mean ± s.e.m. in 7, 7 and 10 mice/group for liver, kidney and lung respectively. (d-e) Diagrams show experimental timelines of methionine choline deficient diet (MCD) fed or chronic CCl4 induced liver fibrosis ± therapeutic administration of IT-603. Histological quantification and representative images of Picrosirius red stained MCD (p value = 0.0044) or chronic CCl4 (p value = 0.001) injured livers pre-treatment and ± therapeutic administration of IT-603. Data are mean ± s.e.m. in 5 pre-treatment mice, 8 vehicle treated MCD mice and 7 IT-603 treated MCD fed mice. Data are mean ± s.e.m. in 5 pre-treatment mice, 7 vehicle treated chronic CCl4 injured mice and 7 IT-603 treated chronic CCl4 injured mice. Scale bars equal 100 microns. (a-c) P values calculated using two-sided student T Test. (d-e) P values were calculated using a one-way ANOVA with Tukey post- hoc t-test. P values equal *P<0.05 and **P<0.01 versus vehicle treatment.

