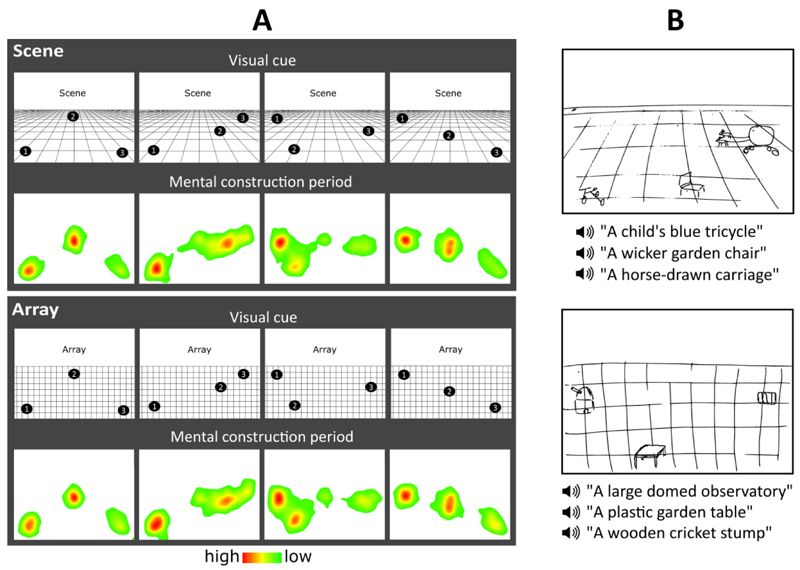
Figure 2.
Eye movements and example drawings. (A) Heat maps for each cue configuration for the scene and array tasks show the fixation count during the 9 s mental construction period. Each heat map is an aggregate of fixations on the blank screen across all trials for that cue configuration across all participants with eye tracking data (n=15). Red indicates higher fixation density and green lower fixation density. (B) Pre-scan training drawings for the scene (top) and array (bottom) tasks from an example participant.

