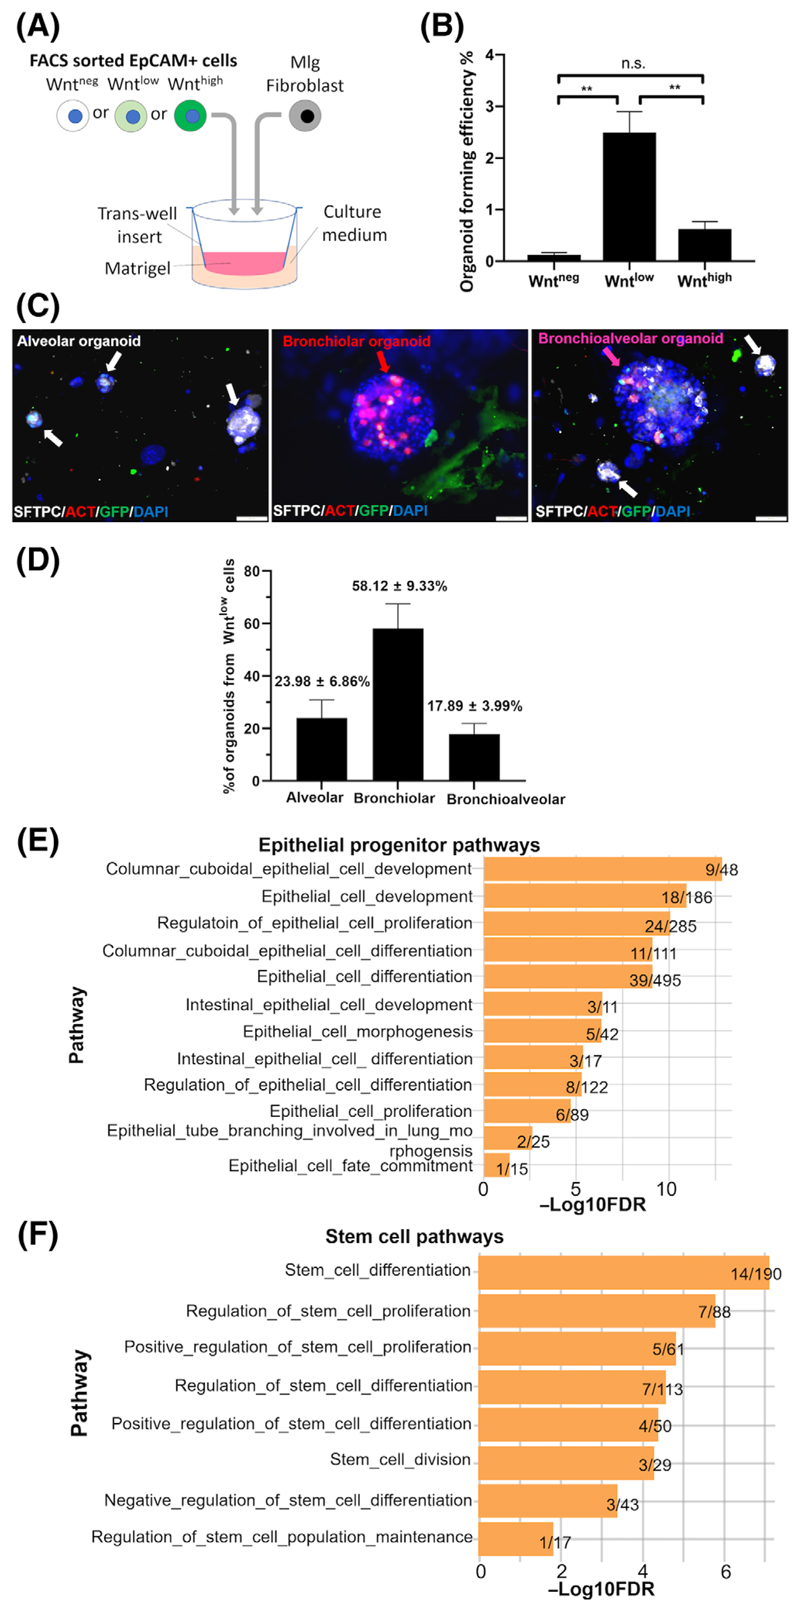
Figure 3.
Organoid forming progenitor cells are enriched in the Wntlow epithelial population. A, Schematic of organoid assay experimental setup. B, Organoid forming efficiency (Organoid count/ Number of seeded cells × 100, %) of sorted Wntneg/low/high fractions in the organoid assay. Data are shown as mean ± SEM (N = 20). Statistics were performed using the mean of triplicate or quadruplicate wells. **P < .01, one-way ANOVA with Bonferroni post-test. C, Representative IF images of alveolar (white arrows), bronchiolar (red arrow), and bronchioalveolar (pink arrow) organoids derived from the Wntlow cells labeled by IF for SFTPC (white), ACT (red), GFP (green), and DAPI (blue). Scale bars = 50 μm. D, Quantification of each type of organoids formed by Wntlow cells. Data are shown as mean ± SEM (N = 3). E,F, Pathways enriched in the Wntlowcells related to, E, epithelial progenitor and, F, stem cell functions. Plotted values are the -Log10FDR values. Data shown on the right end of each bar: the numbers of significantly changed genes (both Wntlow vs Wntneg and Wntlow vs Wnthigh)/total number of genes in each pathway. ACT, acetylated α-tubulin; ANOVA, analysis of variance; DAPI, 40,6-diamidino-2-phenylindole; FDR, false discovery rate; GFP, green fluorescent protein; IF, immunofluorescence

