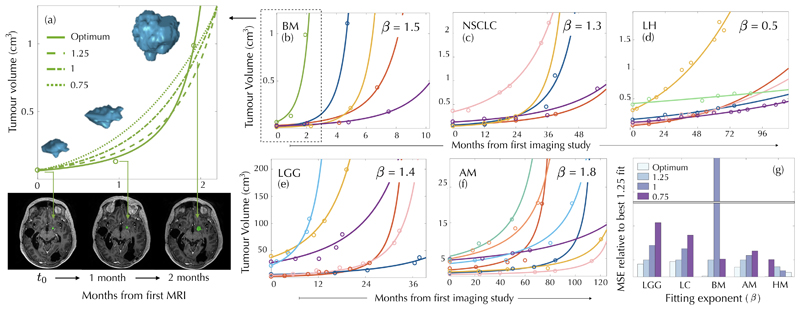
Figure 2. Explosive longitudinal volumetric dynamics of untreated malignant human tumours.
Longitudinal volumetric data for cancer patients with untreated brain metastases (BM), low grade gliomas (LGG), non-small-cell lung carcinomas (NSCLC), atypical meningiomas (AM) and lung hamartomas (LH). Solid curves show the fits with the optimal exponents (values provided in each subplot) giving the smallest mean square errors. The longitudinal 3D reconstruction of a BM and representative axial slices highlighting tumour location at three time points are displayed in the left panel together with the fitting curves obtained for different exponents. Mean square errors (MSE) for the five datasets and exponents 3/4, 1, 5/4 (taken as a reference) in comparison with the optimal exponent, are depicted in the lower right subplot.

