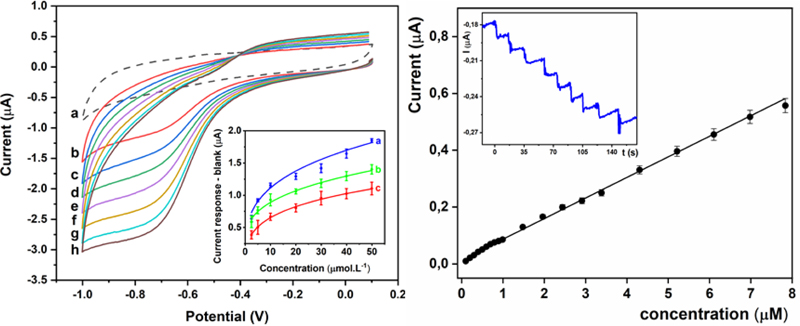
Figure 3.
Left image: cyclic voltammograms CVs of the prepared SOx/MXene-Chi/GCE biosensor in 0.1 M PB pH 7.4 purged by N2 containing 0 (a), 2.5 (b), 5 (c), 10 (d), 20 (e), 30 (f), 40 (g), 50 (h) μM sarcosine at a scan rate of 100 mV s-1 in a potential window from -1.0 V to +0.1 V. Inset: Calibration plots obtained when using no glutaraldehyde (a, blue line), 1% glutaraldehyde (b, green line) and 5% glutaraldehyde (c, red line) during fabrication of the biosensor. Right image: Plot of current responses after subtraction of blank (current response obtained in the absence of sarcosine) of the SOx/MXene-Chi/GCE biosensor measured on a rotating disc glassy carbon electrode at -0.7 V and 900 rpm versus sarcosine concentration. Inset: a current versus time response of the SOx/MXene-Chi/GCE biosensor at -0.7 V to successive addition of stock sarcosine solution in stirred nitrogen-purged 0.1 M phosphate buffer, pH 7.4.

