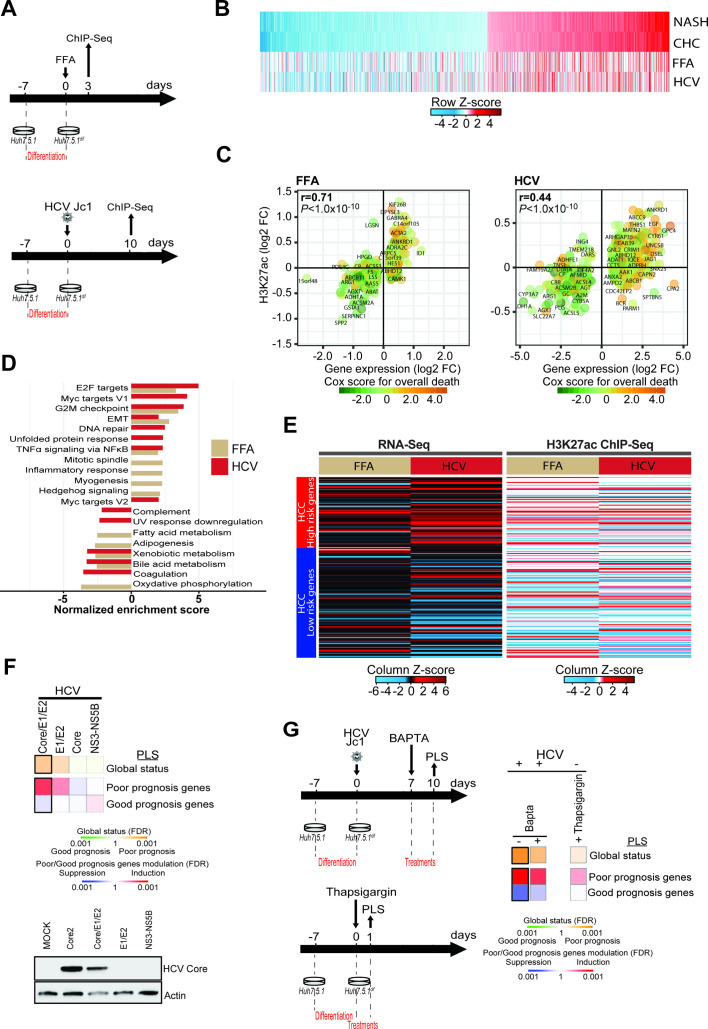
Figure 3.
Modeling of HCV-induced and non-alcoholic steatohepatitis (NASH)-induced histone modifications associated with liver carcinogenesis in a cell culture model. (A) Schematic representation of the experimental setup. H3K27ac marks were profiled by ChIP-Seq following free fatty acid (FFA) treatment (top panel: day 3) or persistent HCV infection (bottom panel: day 10). (B) H3K27ac data of the 1693 genes with significant transcriptomic changes in patients with NASH and chronic hepatitis C (CHC) derived from figure 1B, and corresponding changes in FFA-treated or HCV-infected cells derived from the ChIP-Seq experiment shown in panels A and B. (C) Significant H3K27ac modifications correlate (Spearman’s rank correlation coefficients and p values) with gene expression changes in FFA-treated or HCV-infected cells. Prognostic association of gene expression was determined as described for figure 1B. (D) Gene Set Enrichment Analysis (GSEA) pathway analysis of genes associated with H3K27ac modifications in FFA-treated or HCV-infected compared with Mock or non-infected cells from the ChIP-Seq experiment shown in panels A and B. (E) Heatmap of the prognostic liver signature (PLS) based on the transcriptome (left panel) and epigenome (right panel) of FFA-treated or HCV-infected cells. (F, G) Effect of ectopic expression of HCV proteins, thapsigargin and 1,2-bis(o-aminophenoxy)ethane-N, N, N′, N′-tetraacetic acid (BAPTA) treatment on the PLS status. Heatmaps show: (top) the classification of the PLS global status as poor (orange) or good (green) prognosis; (bottom) the significance of induction (red) or suppression (blue) of PLS poor-prognosis or good-prognosis genes. FDR, false discovery rate.

