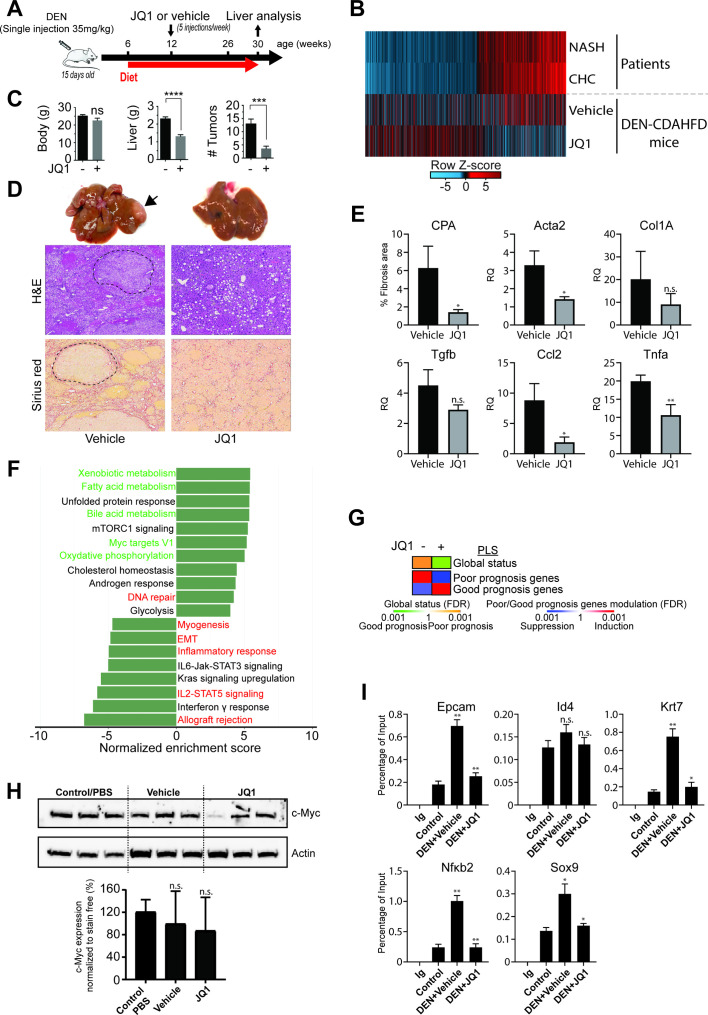
Figure 5.
Bromodomain (BRD)4 inhibitor JQ1 reduces liver tumour burden in a mouse model of non-alcoholic steatohepatitis (NASH)-hepatocellular carcinoma (HCC). (A) Schematic representation of the proof-of-concept study using a mouse model of DEN and choline-deficient, L-amino acid-defined, high-fat diet (CDAHFD)-induced hepatocarcinogenesis. (B) Transcriptomic changes of genes with significant H3K27ac modifications from livers from patients with NASH and chronic hepatitis C (CHC) as explained in figure 1D (overlapping genes) and corresponding changes in vehicle or JQ1-treated DEN/CDAHFD mice. (C) JQ1 significantly reduces tumour burden in vivo. While body weights are stable, liver weights as well as the numbers of tumours are significantly (*p<0.05; ***p<0.001; ****p<0.0001, unpaired t-test) reduced in JQ1-treated (n=8) compared with untreated (n=8) mice. Results are expressed as means±SEM. (D) Representative macroscopic photographs of livers (x 1.5 magnified), H&E and Sirius red staining of liver sections from vehicle and JQ1-treated mice. Tumour nodules are indicated by an arrow head and are delimited by dashed lines. (E) JQ1 efficiently reduces liver fibrosis and inflammation. Fibrosis stage was evaluated through quantitative digital analysis of whole-scanned liver sections (collagen proportional area (CPA)) and fibrotic gene expression in JQ1-treated (n=3) compared with JQ1-untreated (n=3) mice. Results are expressed as means±SD. (D) Expression of inflammatory genes Ccl2 and Tnfα are shown as means±SD (*p<0.05; **p<0.01, unpaired t-test). Gene expression was assessed by quantitative reverse transcription (qRT)-PCR. (F) Gene Set Enrichment Analysis (GSEA) pathway analysis of transcriptional changes in JQ1-treated DEN/CDAHFD mouse livers. Normalised enrichment scores (NES) of significantly enriched hallmark pathways derived from RNA-Seq analysis of livers from vehicle (n=3) and JQ1-treated (n=3) mice compared with control/phosphate-buffered saline (PBS) (n=5) mice. JQ1 partially reverses the NASH-mediated and HCV-mediated induction (red labels) or repression (green labels) of pathways identified in patients with NASH and/or CHC. (G) PLS status and expression of HCC high-risk/low-risk genes from the RNA-Seq analysis shown in panel D. Heatmaps show: (top) the classification of the PLS global status as poor (orange) or good (green) prognosis; (bottom) the significance of induction (red) or suppression (blue) of PLS poor-prognosis or good-prognosis genes. FDR, false discovery rate. (H) Western blot analysis showing c-Myc protein expression in control/PBS (n=3), vehicle (n=3) or JQ1-treated (n=3) mouse livers. Bottom panel graph shows the quantification of western blot analysis from six different animals (n.s., non-significant; unpaired t-test). (I) Recruitment (ChIP-qPCR assays) to the promoter-enhancer regions of indicated genes, using liver of control, DEN/CDAHFD and JQ1-treated mice, using IgG and BRD4 antibodies (*p≤0.05; **p≤0.01; Mann-Whitney U test).

