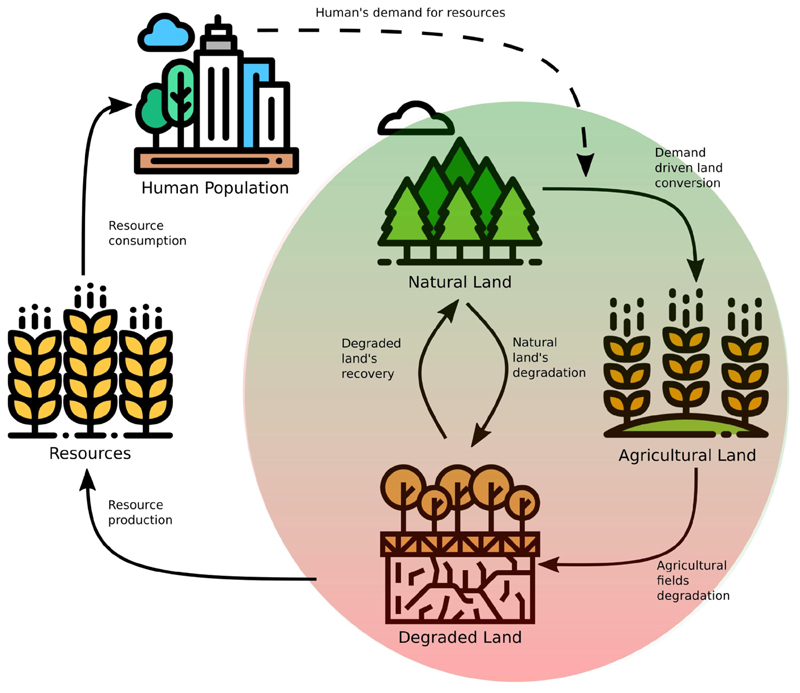
Fig. 1. Model’s graphical representation.
The right part of the diagram represents the landscape, composed of natural land, agricultural land and degraded land. The arrows between the three land types represent the possible land transformations we consider (conversion, recovery, degradation). Both the agricultural intensity and the landscape composition determine the number of resources that are produced and consumed by the human population. Human demography is entirely determined by resource access. Changes in the human population size modify the population’s demand for resources and feedback on the landscape’s composition by increasing or decreasing the conversion of natural land for agricultural purposes.

