Abstract
Three catadromous Pacific eels (2 Anguilla marmorata, 1 A. megastoma) from the Archipelago of Vanuatu were tagged with pop-up satellite archival transmitters and their migration tracks towards their presumed spawning area approximately 870 km northeast of the point of release were reconstructed in order to evaluate their movements in relation to oceanographic conditions. We used the timing of diel vertical migrations to derive the eels’ positions. Two A. marmorata exhibited steep-angled turns resulting in a zig-zag migration path along the east-west axis, while one A. megastoma took a relatively straight course towards the presumed spawning area. They migrated with a speed over ground of 21-23 km day−1. In this region, the eastward flow of the South Equatorial Counter Current (SECC, ∼ 5-10°S) separates the westward flowing South Equatorial Current (SEC; ∼0-5°S and 10-18°S) into two branches. During shallower nighttime migration depths around 150 m eels crossed a variable flow field through the southern branch of the westward SEC with westward propagating mesoscale eddies and the eastward SECC, but stayed south of the stronger northern branch of SEC possibly increasing retention time of larvae within this area. The eels headed towards a tongue of high-salinity Subtropical Underwater (STUW) that may have provided cues for orientation. The eels did not move beyond a salinity front of 35.9-36.0 at a depth of 100-200 m, which may have provided cues for orientation towards the spawning area. These 3 tracks may represent the movements of mature silver eels all the way to where they spawn.
Keywords: Anguilla, Migration routes, Diel vertical migration, Satellite telemetry, Spawning
Introduction
Since the epic spawning migrations of European eels (Anguilla anguilla) were reported during the 1920s, biologists have marvelled at this more than 5000 km journey across the Atlantic Ocean to the Sargasso Sea (Schmidt 1922). Inspired by this landmark discovery, oceanic spawning areas for other anguillid species were found or narrowed down (Ege 1939, Jespersen 1942, Tsukamoto 1992; Kuroki et al. 2008, Miller et al. 2015), but even a century later the mystery remains about how eels orient and navigate through the seemingly featureless open ocean (Tsukamoto 2009, Righton et al. 2012, Westerberg 2014, Schabetsberger et al. 2016). Likely, they integrate information from various sensory systems such as vision, hearing, mechanoreception, pressure detection, chemo-, electro-, and magnetoreception (McCleave et al. 1987, Tesch 2003, Tsukamoto 2009, Hunt et al. 2013; Tsukamoto et al. 2011), but the relative importance for orientation is unknown. The energetic constraints of this long-distance migration have been discussed as one possible cause for the drastic decline of temperate eel stocks, as mature silver eels are weakened by introduced parasites, toxic chemicals and dams in their freshwater habitats and may not reach their spawning areas (Righton et al. 2012 and references therein).
For better understanding of the eel’s orientation in the ocean, their migration routes need to be tracked. The development of satellite pop-up archival transmitters (PSATs) provided first insights into the remarkable diel vertical migration behavior of eels, quickly descending from 100-300 m nighttime depth down to greater than 600 m during the day (Aarestrup et al. 2009, Jellyman & Tsukamoto 2010, Béguer-Pon et al. 2017, Higuchi et al. 2018 and references therein). However, global positioning does not work when the tags are submerged. Even though the PSATs are equipped with light sensors, the ambient light levels at these depths are too low to estimate light-based geolocation. Hence, the eel’s diel vertical migration behavior is used to estimate times of sunrise and sunset in order to estimate longitude and latitude. Temperature and depths may additionally be used to refine potential latitude, if strong enough temperature gradients are present (Béguer-Pon et al. 2015a, Chow et al. 2015, Righton et al. 2016). Moreover, the migration routes of virtual eels have been simulated using numerical models (Béguer-Pon et al. 2015b, 2016, Chang et al. 2016). Data collected for European eels suggested that they may not necessarily minimize the distance to reach the Sargasso Sea, but rather follow the reverse direction of the subtropical gyre that may have carried them as larvae towards Europe potentially navigating along olfactory cues originating in the spawning area or oceanic cues imprinted during larval migration (Righton et al. 2016).
Comparatively little is known about the migrations of tropical and temperate eels in the Indopacific region (Aoyama et al. 2003, Kuroki et al. 2014). There are six species (Anguilla marmorata, A. megastoma, A. reinhardtii, A. obscura, A. australis, A. dieffenbachii) living in the western South Pacific. During 2012 and 2013, three different tropical anguillid species (Anguilla marmorata, A. megastoma, A. obscura) departing from Gaua Island in Vanuatu were tagged with long-term pop-up satellite transmitters to follow their migrations (Schabetsberger et al. 2013, 2015). Up to 23% of caught eels were found to be putatively admixed individuals between A. marmorata and A. megastoma (Schabetsberger et al. 2015, Barth et al. 2020). Particularly, three eels (two A. marmorata and one A megastoma) out of 15 tagged fish exhibited long-distance migrations with their tags surfacing more than 800 km away from release locations, and pop-up north east of Gaua after 3-5 months (Schabetsberger et al. 2015). While the two marmorata kept their tags until the pre-programmed release, the A. megastoma may have been eaten by a predator or it was weakened and died within the spawning area (Schabetsberger et. al 2015, Table 1). Leptocephalus larvae of both species (> 25 days old) had been collected close to the pop-up location of our tags (Kuroki et al. 2008, 2020). These lines of evidence suggest that both species may spawn across this area.
Table 1.
Fish number (number in Schabetsberger et al. 2015), tag number, year, species, status of injury, total length, body weight, deployment duration, tag release, total distance covered, mean speed over ground, and pop-up position of three eels caught on Gaua 538 Island and equipped with satellite tags.
| Eel Number | 1 (1) | 2 (6) | 3 (8) |
|---|---|---|---|
| Tag | 113291 | 128005 | 128006 |
| Year | 2012 | 2013 | 2013 |
| Species | A. marmorata | A. marmorata | A. megastoma |
| Capture | Hooking mark | unhurt | unhurt |
| TL (cm) | 129.6 | 121.5 | 118.0 |
| BW (kg) | 5.7 | 4.8 | 3.8 |
| Duration (montds) | 3 | 5 | 3 |
| Tag release | On-time | On-time | Premature (2 montds early) |
| Distance covered (km) |
1952 | 3257 | 1717 |
| Mean speed (km d−1) |
23.2 | 21.0 | 22.9 |
| Pop-up location | 8.770°S, 173.016°E | 9.233°S, 170.462°E | 10.322°S, 174.614°E |
Ocean current, salinity, and temperature fields may provide signposts for migrating eels. A distinct salinity maximum at about 150 m depths at the pop-up locations corresponding to the thermocline and the upper nighttime eel migration depths may act as a landmark for this spawning area (Schabetsberger et al. 2015). Data from Japanese eels (A. japonica) suggest multiple spawning during consecutive new moon periods at around this depth (Tsukamoto et al. 2011). The aim of the present study was to reconstruct the migration paths of 3 tropical eels and to understand their migration in relation to oceanographic conditions.
Materials and Methods
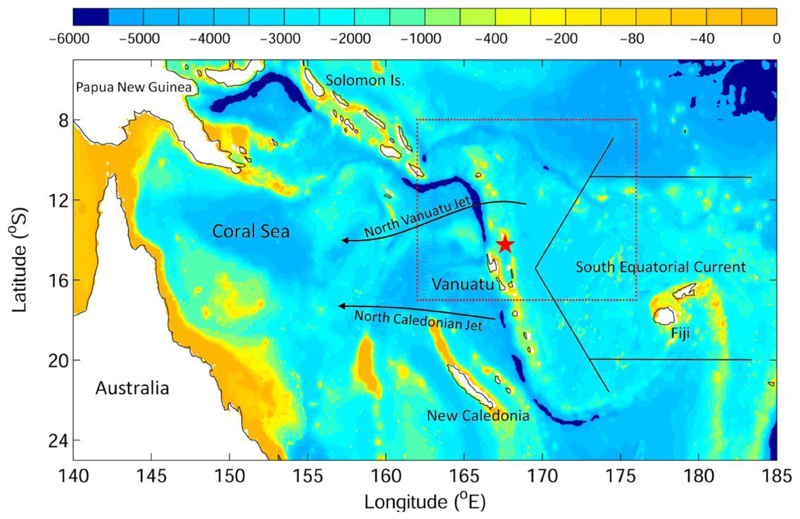
Catching and tagging procedures had been described in detail in Schabetsberger et al. (2013, 2015). Briefly, the large female eels were caught by local fishermen snorkeling in the outflow of Lake Letas, Gaua Island, Vanuatu in 2012 and 2013 (14.261444 °S, 67.604716 °E, Fig. 1). During the first year, the eels were hooked at their tails and pushed into handnets, while in the following year the local fishermen had learned to catch the eels unharmed. The eels were first then kept in a net within the river for few days, and later released 4 km offshore tagged with PSATs.
Fig. 1.
The bathymetry in the western South Pacific. The dotted box shows the study region, and the red star marks the release location. The schematic arrows indicate the major ocean currents.
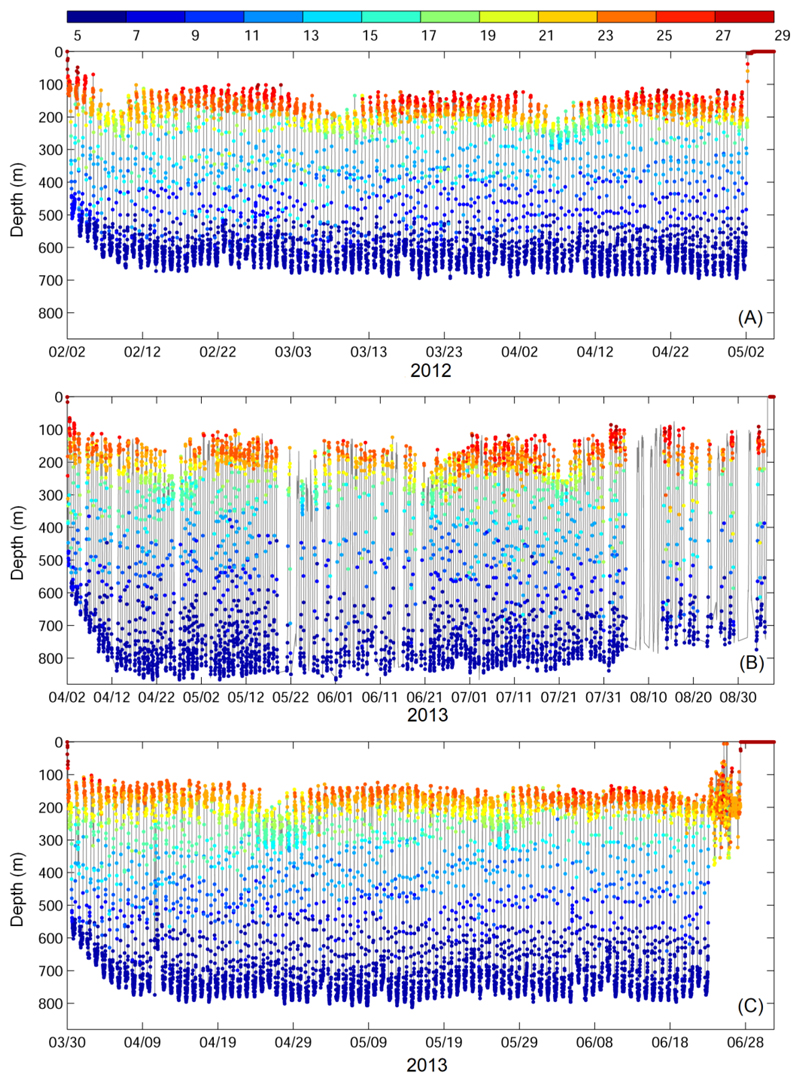
Eels avoided depths at which light was measurable by the tag sensors during their vertical migrations (Schabetsberger et al. 2013, 2015). As a consequence, no measurements were available from the light sensors to estimate the eels’ geolocations. To overcome this limitation, we used the timings of the diel vertical migrations to estimate the times of sunrise and sunset to further derive longitude and latitude. In other words, we took advantage of the eels’ eyes as light sensors that they use to avoid visual predators (Béguer-Pon et al. 2015a, Chow et al. 2015, Righton et al. 2016). The proportions of data recovered from the three tags were 85%, 49% and 92% for eels 1, 2 and 3, respectively (Fig. 2).
Fig. 2.
Vertical migration of for Eels 1 (A, Anguilla marmorata), 2 (B, Anguilla marmorata), and 3 (C, Anguilla megastoma) with the temperatures experienced by the eels shown on the colour bar.
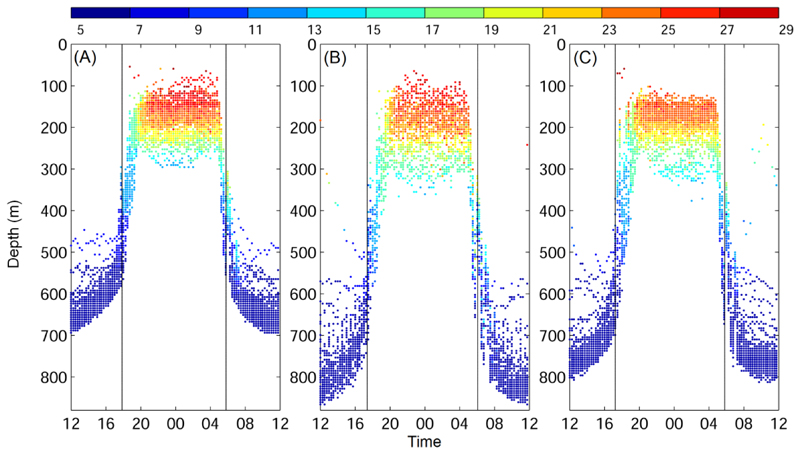
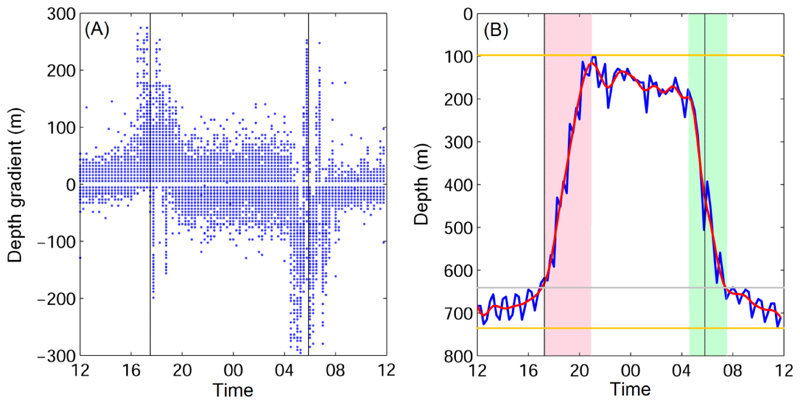
The next step was to estimate the sunrise and sunset times from the diel vertical migrations. The composite of diel vertical migration and the mean sunrise and sunset times indicated eels started to ascend to shallow water upon sunset, but had started to descend to the deep layer before sunrise (Fig. 3). At sunrise, the eels were about halfway down on their descent. During the ascending and descending periods, depths changes in time were much greater than during daytime and nighttime when eels tended to undergo less distinct vertical movements. Therefore, the depth gradients were then used to estimate the ascending and descending periods. The composite depth gradient showed that eels nevertheless continued up and down movements during both, daytime and nighttime (Fig. 4). Due to restricted battery life and size limitations of transmitted data packets, temperature and depth readings are compressed before they are transmitted to Argos satellites. If a fish dives more than 166.8 m or ascends more than 172.1 m in a one-hour period, then the minimum and maximum depth delta limits are transmitted. The same holds true if the temperature readings differ beyond a predetermined but variable threshold. Delta-limited depth and temperature records may not capture the actual extent of steep vertical movements and rapid temperature variations.
Fig. 3.
Diel vertical migrations and the along-path temperature (color) for Eels 1 (A, Anguilla marmorata), 2 (B, Anguilla marmorata), and 3 (C, Anguilla megastoma). Vertical lines show the averaged sunset and sunrise over the migration period.
Fig. 4.
Depth gradient (A) and example of daily vertical migration from Eel 3 (Anguilla megastoma) on Apr 4th, 2013 (B). Positive and negative gradient represents ascending and descending, respectively. The red curve in (B) is the 45 minutes (3-time steps) running average. Pink and green shading indicates increased positive (ascending) and negative (descending) gradient, respectively. The two vertical lines show sunrise and sunset. The grey horizontal line marks the daytime minimum depth; the two yellow lines are the daily maximum and minimum depths.
In order to judge the depth gradient more accurately, the 45-minute (3-time step) running mean was calculated first (red curve in Fig. 4B). Sunrise and sunset fell into the two steep gradient periods (Fig. 4B). They were defined as:
Sunset: the beginning of the steep positive gradient (pink shading, Fig. 4B)
Sunrise: median of the steep negative gradient (green shading, Fig. 4B)
The periods of steep positive and negative gradients for sunset and sunrise were defined as the periods when the gradient was greater than the gradient before sunset (13-15 pm Local Solar Time, LST averaged) and before sunrise (1-3 am LST averaged), respectively. Using the depth gradients was intuitive as they directly reflected the ascending and descending movements. The next step was to estimate local midnight time based on derived sunrise and sunset times, which then could be used to further estimate longitude following Hill and Braun (2001). The local midnight time (1) and the longitude (2) were estimated as:
| (1) |
| (2) |
In which midnight time used for estimating longitude followed UTC hours, and equation of time (Hughes et al. 1989) was derived using Matlab toolbox (https://www.mathworks.com/matlabcentral/fileexchange/32793-equation-of-time).
Temperature gradient fitting with reanalysis model data was applied to estimate the latitude in American eels departing from east of Nova Scotia, Canada (Béguer-Pon et al. 2015a). However, the temperature gradient was much greater in this mid-latitude region (0.7-1.0°C 100 km-1), whereas the tropical ocean is generally warmer and exhibits a relatively small temperature gradient (< 0.1°C 100 km-1). Our observation also revealed little change of temperature during daytime or nighttime throughout the tracking period (Fig. 2). Therefore, the temperature gradient could not be used to estimate latitude for migrating tropical eels. We also tried to derive latitude from day lengths (Hill and Braun 2001), but failed due to large variations (> 10°). Hence, we assumed that latitude decreased linearly with time, or, in other words, that the eels constantly swam northward from release to pop-up location. Since most data points were available in 15 min intervals, we used ±7.5 minutes to estimate the error for sunrise and sunset times. This led to ±1.875° error deviation when substituted into equation (1) and (2). In a few cases, the time interval increased to 30 or even 45 minutes. Due to uncertainties of estimated sunrise and sunset times, we applied smoothing over a 15-day period, after which swimming speeds and trajectories approached stable values (rate changes < 1% after 12-15 days smoothing).
The ocean circulation model uses the operational Mercator global ocean analysis and forecast system from Copernicus Marine Environment Monitoring Service (CMEMS). It provides the three-dimensional currents and hydrological fields that were used in showing the oceanic condition in the present study. The CMEMS is a global model, with a horizontal resolution of 1/12 degree and 50 vertical layers, and was constructed based on Nucleus for European Modelling of the Ocean (NEMO). CMEMS covers the period from 2007 to the present, and the data during the tracking period for the three eels in 2012 and 2013 were used in this study.
Results
Migration routes and swimming behavior
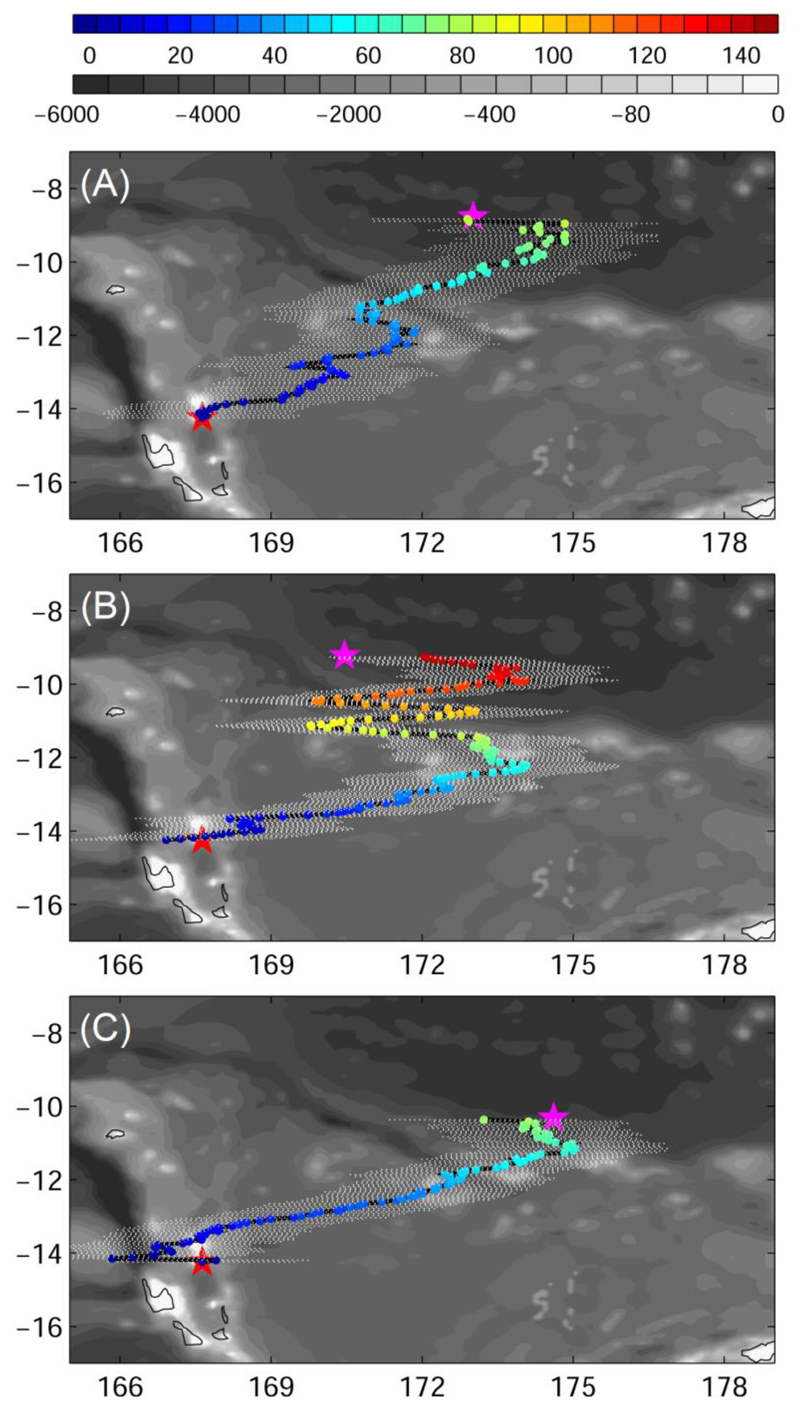
The three female eels generally took a northeastward direction and headed towards the final pop-up locations (Fig. 5). However, both A. marmorata (Eels 1 and 2) exhibited 4-5 steep angled turns resulting in a zig-zag migration path along the east-west axis. Eel 1 showed this behavior during the first half of its journey, while Eel 2 started this 435-455 km east-west movements 805 km from the presumed spawning area. In contrast, the onlymegastoma (Eel 3) migrated for about 190 km away from the postulated target direction before it reversed its course and headed on a comparatively straight course for the presumed spawning area. The tag popped up prematurely after three months and likely drifted westward during the end of the eel’s journey (Fig. 2). The mean estimated distance covered was 1952 (Eel 1), 3257 (Eel 2), and 1717 km (Eel 3), which led to mean travelling speeds over ground of 23.2 (±17.3 standard deviation), 21.0 (±15.3), and 22.9 (±11.8) km d-1.
Fig. 5.
Estimated migration path for Eels1 (A, Anguilla marmorata), 2 (B, Anguilla marmorata), and 3 (C, Anguilla megastoma). The colour corresponds to days after departure from release locations. The red and magenta star represents release and pop-up location, respectively. Grey shading shows the bathymetry. Black curves represent the estimated path of eels. White dots show the error of ± 1.875°.
Oceanographic conditions
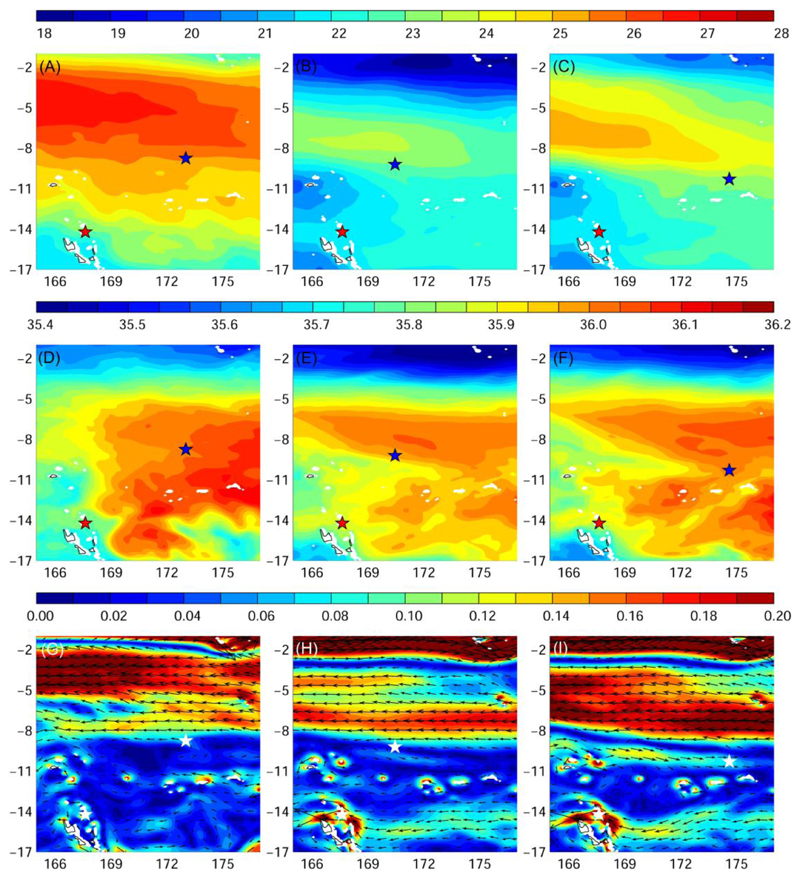
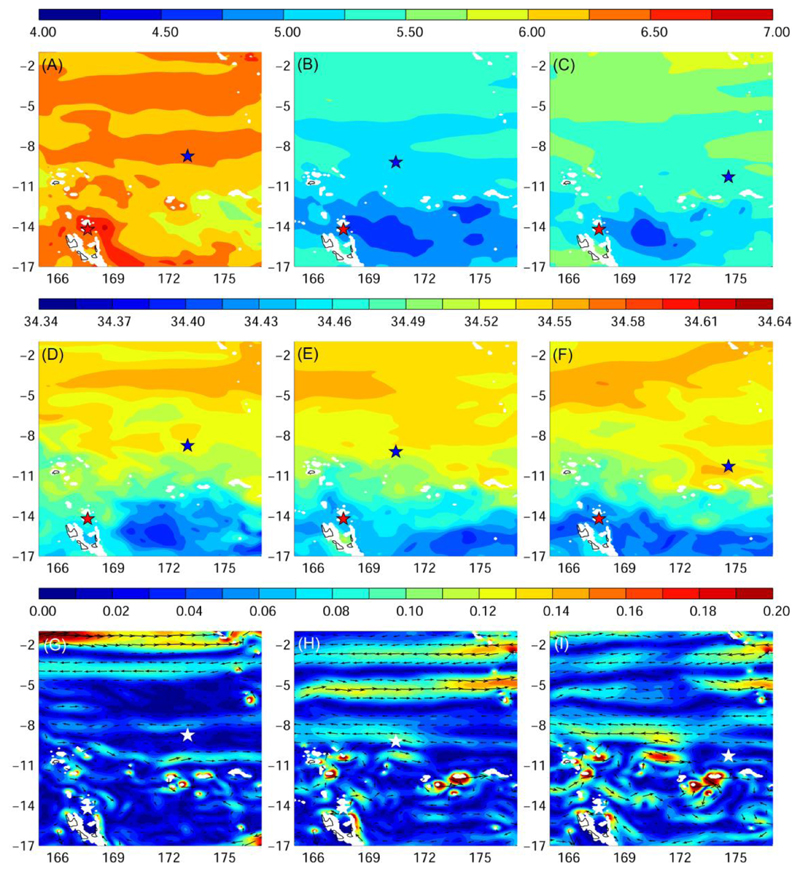
The three eels experienced different ocean conditions depending on the highly dynamic interannual changes in flow patterns in this region. They were exposed to a higher variability in temperature, salinity, and current fields during the night, compared to more stable conditions at greater depths during the day (Figs. 6 & 7).
Fig. 6.
Average temperature (°C, A-C), salinity (D-F), and ocean current fields (m s−1, G-I) at median nighttime migration depths of eels experienced during their migration (± robust standard deviation, Hyslop and White 2009); left: Eel 1, Anguilla marmorata, 174 ± 30 m; middle: Eel 2, Anguilla marmorata, 188 ± 45 m; right: Eel 3, Anguilla megastoma, 177 ± 21 m). Red and blue (or white) star represents release and pop-up location, respectively.
Fig. 7.
Average temperature (°C, A-C), salinity (D-F), and ocean current fields (m s-1, G-I) at median daytime migration depths of eels during their migration (± robust standard deviation; left: Eel 1, Anguilla marmorata, 653 ± 21 m; middle: Eel 2, Anguilla marmorata, 806 ± 30 m; right: Eel 3, Anguilla megastoma, 758 ± 21 m). Red and blue (or white) star represents release and pop-up location, respectively.
Temperatures increased northward as the eels moved towards the potential spawning area. During nighttime (∼ 180 m), they seemed to prefer temperatures around 22-25°C (Fig. 6A-C & Figs. S1-3A). During daytime (∼650-800 m), eels traversed a flat temperature gradient slightly increasing towards the potential spawning area travelling to ∼6.2°C and 5.2-5.8°C in 2012 and 2013, respectively (Fig. 7A-C & Figs. S4-6A).
Eels headed towards the high-salinity core of the Subtropical Underwater (STUW) that propagates westward at their upper nighttime migration depth. In the potential spawning area all three individuals seemed to prefer salinities around 35.9-36.0 (Fig. 6D- F & Figs. S1-3B). At the daytime migration depths eels crossed a salinity gradient ascending south to north and did not move beyond a salinity of 34.5 (Fig. 7D-F & Figs. S4-6B).
At their upper nighttime migration depth the eels departed between two strong westward jets, the North Vanuatu and North Caledonia Jets (also see Fig. 1). After leaving these westward currents they were exposed to a variable flow field of weak east- to westward currents (< 0.1 ms-1). Once they got to the potential spawning area at the border of the SECC and northern branch of the SEC, the eels did not migrated into the stronger flow of the westward SEC that reaches down to the eel’s upper migration depths (Fig 7G-I & Figs. S1-3C). At their deep daytime residence, they experienced even weaker currents flowing either east- or westward (Fig. S4-6C). During the last new moon period before pop-up, the eels experienced nighttime temperatures and salinities from 23.2 to 24.2°C and 35.9 and 36.0, respectively. They were exposed to weak east and westward currents < 0.05 ms-1 (Table 2).
Table 2.
Oceanographic conditions experienced by the eels during nighttime (9pm-3am) of the last new moon periods near the spawning area recorded by the tags. Salinity (S), zonal (U) and meridional (V) velocities were extracted from the model. Numbers represent mean values (and standard deviations). Temperature data are used from the tags.
| Eel Number | 1 (A. marmorata) | 2 (A. marmorata) | 3 (A. megastoma) |
|---|---|---|---|
| Time (days since release) |
78-83 | 123-128 | 73-77 |
| Eel depth (m) | 164.8 (18.6) | 148.6 (25.5) | 169.9 (14.6) |
| T (°C) | 23.2 (2.7) | 24.2 (2.0) | 23.6 (1.8) |
| S | 36.04 (0.003) | 35.91 (0.040) | 35.97 (0.019) |
| U (m s−1) | 0.015 (0.016) | 0.038 (0.021) | 0.020 (0.019) |
| V (m s−1) | 0.054 (0.003) | −0.040 (0.027) | −0.034 (0.020) |
Discussion
The three individual South Pacific eels likely were the first ever that carried satellite tags from near their freshwater habitat all the way towards their hypothetical spawning area located about 870 km northeast from the point of release. Although the final proof by catching ripe spawners, eggs or preleptocephali is missing, several lines of evidence suggest that eels spawn in this region: Tags from both species popped up in within a mean (±standard deviation) radius of about 167±49 km, irrespective of being attached for either 3 or 5 months during consecutive years. Additionally, leptocephali of A. marmorata (25-155 days old), A. megastoma (71-117 d), A. obscura (37 d) and A. australis (25 d) were caught in this region northwest of Fiji (Kuroki et al. 2008, 2020). By exploiting the eel’s distinct diel vertical migration behavior we were able to coarsely reconstruct their migration paths towards this spawning area. The eels predictably descended before sunrise and ascended upon sunset, potentially avoiding predators hunting in shallower water during dawn and dusk (Chow et al. 2015, Hammerschlag et al. 2017).
The zig-zag movements of Eels 1 and 2 could have resulted from the uncertainty of our longitude estimates. The sampling interval of 15 min leads to a minimum error of 1.875°. Additionally, the timing of DVM may, to an unknown extent, shift with cloud cover and our assumption of a constant northward movement is improbable, yet we were unable to solve these problems. Migrating silver eels could have been deflected by ocean currents, although they seem to be able to swim out against even stronger flow than seen in this study (see Béguer-Pon et al. 2016, Righton et al. 2016). Alternatively, the tracks may indeed reflect an active zig-zag searching behavior of eels for cues to guide them along a pathway to a specific destination. The eels may take the risk of a prolonged journey in order to locate mates (see also Béguer-Pon et al. 2017 for changes in direction). Eel 2 seemed to follow the bathymetry along the Vitiaz Trench Lineament/Melanesian Border Plateau (Pelletier & Auzende 1996). As it could not reach the bottom (> 2000 m), it may have tracked obvious magnetic anomalies along these features (World Digital Magnetic Anomaly Map, Dyment et al. 2020).
The animations show that the eels crossed a variable flow field towards the border of the eastward SECC and the westward northern branch of the SEC, but they did not seem to enter into the stronger flow of the SEC. The region where tags popped up may provide good conditions for larval growth and dispersal: Several eddies were observed along the estimated migration routes (see Figs. S1-S3). The rotating and westward propagating features could trap and transport eel larvae, affecting their migration speed and direction (Chang et al. 2017). Thereby they could potentially also increase the retention time within the region. Depending on their residence depths, larvae growing in this area could drift west- or eastward. Genetic data collected throughout the WSP suggest panmixia of both species (Gubili et al. 2019) and support the hypothesis that leptocephali hatched in this area could reach different archipelagos west or east of it.
The eels migrated across a high-salinity core of the Subtropical Underwater around 100-200 m depth that is formed by saltier water being subducted from the surface into the lower thermocline (Price 2001). This tongue of high-salinity water may provide stable water mass signatures or olfactory cues for orientation (Schabetsberger et al. 2015, Kuroki et al. 2020). The three tags popped up within latitudinal salinity and temperature gradients forming between the two opposite current systems of 35.9-36.0 and 23-24°C, respectively. Optimum salinities and temperatures for egg development in tropical eels have not been determined under laboratory conditions, but the values above roughly correspond to the most favorable conditions observed in temperate eels (salinity ~35; 20 to 25°C; Dou et al. 2008, Okamoto et al. 2009, Ahn et al. 2012, Unuma et al. 2012, Sørensen et al. 2016).
The eels reached the area with estimated migration speeds over ground (21-23 km d-1) that were similar to estimates from temperate species (A. rostrata 35-54 km d-1, A. dieffenbachii 15 -31 km d-1, A. anguilla 2-51 km d-1; Béguer-Pon et al. 2017 and references therein). All three eels exhibited very regular and distinct diel vertical migrations and seemed unaffected by tagging, so they likely were in good physical condition and the speeds were likely natural. The negative effects of externally attached tags observed in smaller European eels may be reduced in this comparatively large and well-nourished tropical eels (Burgerhout et al. 2011, Methling et al. 2011). It also remains to be determined if more invasive tagging techniques applied during earlier studies could actually have caused accelerated escape movements > 50 km d-1.
Even though the magnetic sense would be sufficient to reach their destination (Durif et al.2013), eels likely use a set of senses to first locate their general spawning area and then to find their mates within optimal conditions for reproduction. Since eels likely spawn at their nighttime migration depths in the shallower water (Tsukamoto et al. 2011), the oceanographic features there are likely to have greater importance for orientation and navigation than those during the day at deeper depths beyond 600 m where the eels may hide from predators and do approach their physiological limits for movement. In these layers of the STUW ripe eels may have to actively search for odor trails of individual conspecifics to find mates by following smell wafted down by the currents (Sillar et al. 2016). Some tropical eels seem to spawn throughout the year (Aoyama et al. 2003, Arai & Abdul-Kadir 2017) and the numbers of spawners aggregating at one time may be small compared to temperate eels (estimated to be < 500 spawners per spawning event; Pujolar & Maes 2016). Finding suitable mates in the vast ocean may require a risky and strenuous prolongation of the eels’ spawning migration when they are nearing or have reached maturity.
In summary, the three eels exhibited regular diel vertical migrations and at least the two A. marmorata seemed to swerve east or west while moving towards their final destination. They likely stopped before reaching the faster flowing northern branch of the SEC and remained within salinity and temperature fronts. Shorter time intervals between measurements (larger data volume transmitted to Argos) would increase the accuracy of the position estimates from diel vertical migrations. Obviously, large tagging campaigns are needed to monitor movement patterns within the spawning area. In the future, tags with higher transmission rates and/or superior light sensitivity would provide more accurate estimates. With expected miniaturization and price reduction of tags, many eels could be equipped with pop-up satellite transmitters as well as acoustic tags and then potentially guide ship-based oceanographers to spawning events (see also Wysujack et al. 2014).
Supplementary Material
Variability of the temperature (A), salinity (B), and current field (C) at the median nighttime depth (± robust standard deviation, 174 ± 30 m) of Eel 1 (Anguilla marmorata) during its migration in the western South Pacific. The black circle and star are the departure and pop-up locations, respectively, and the triangle represents the position of the eel along its estimated migration route at each time step.
Variability of temperature (A), salinity (B), and current field (C) at the median nighttime depth (± robust standard deviation, 188 ± 45 m) of Eel 2 (Anguilla marmorata) during its migration in the western South Pacific. The black circle and star are the departure and pop-up locations, respectively, and the triangle represents the position of the eel along its estimated migration route at each time step.
Variability of temperature (A), salinity (B), and current field (C) at the median nighttime depth (± robust standard deviation, 177 ± 21 m) of Eel 3 (Anguilla megastoma) during its migration in the western South Pacific. The black circle and star are the departure and pop-up locations, respectively, and the triangle represents the position of the eel along its estimated migration route at each time step.
Variability of temperature (A), salinity (B), and current field (C) at the median daytime depth (± robust standard deviation, 653 ± 21 m) of Eel 1 (Anguilla marmorata) during its migration in the western South Pacific. The black circle and star are the departure and pop-up locations, respectively, and the triangle represents the position of the eel along its estimated migration route at each time step.
Variability of temperature (A), salinity (B), and current field (C) at the median daytime depth (± robust standard deviation, 806 ± 30 m) of Eel 2 (Anguilla marmorata) during its migration in the western South Pacific. The black circle and star are the departure and pop-up locations, respectively, and the triangle represents the position of the eel along its estimated migration route at each time step.
Variability of temperature (A), salinity (B), and current field (C) at the median daytime depth (± robust standard deviation, 758 ± 21 m) of Eel 3 (Anguilla megastoma) during its migration in the western South Pacific. The black circle and star are the departure and pop-up locations, respectively, and the triangle represents the position of the eel along its estimated migration route at each time step.
Acknowledgements
Funding for this study was provided by the Austrian Science Fund (P28381-B29). Field work was carried out under a permit issued by the Department of Environmental Protection and Conservation (DEPC, 1 March 2013) and in concordance with the code of ethics for foreign researchers from the Government of Vanuatu.
These data were made freely available by the Copernicus Marine Environment Monitoring Service (http://marine.copernicus.eu). We thank Finn økland, Ursula Sichrowsky, Meelis Tambets, Donna Kalfatak, Alexander Scheck, the “Togase Family”, and the “Black Beach Boys” for help in the field. Michael J. Miller and the reviewers provided valuable comments.
Literature Cited
- Aarestrup K, Økland F, Hansen MM, Righton D. Oceanic spawning migration of the European eel (Anguilla anguilla) Science. 2009;325:1660. doi: 10.1126/science.1178120. [DOI] [PubMed] [Google Scholar]
- Ahn H, Yamada Y, Okamura A, Horie N, Mikawa N, Tanaka S, Tsukamoto K. Effects of water temperature on embryonic development and hatching time of the Japanese eel Anguilla japonica . Aquaculture. 2012;330(333):100–105. [Google Scholar]
- Aoyama J, Wouthuyzen S, Miller MJ, Inagaki T, Tsukamoto K. Short-distance spawning migration of tropical freshwater eels. Biol Bull. 2003;204:104–108. doi: 10.2307/1543500. [DOI] [PubMed] [Google Scholar]
- Arai T. Abdul Kadir SR Opportunistic spawning of tropical anguillid eels Anguilla bicolor bicolor and A. bengalensis bengalensis . Sci Rep. 7 doi: 10.1038/srep41649. 41649. [DOI] [PMC free article] [PubMed] [Google Scholar]
- Barth JMI, Gubili C, Matschiner M, Tørresen O. Stable species boundaries despite ten million years of hybridization in tropical eels. Nat Comm. 2020;1 doi: 10.1038/s41467-020-15099-x. 1433. [DOI] [PMC free article] [PubMed] [Google Scholar]
- Béguer-Pon M, Castonguay M, Shan S, Benchetrit J, Dodson JJ. Direct observations of American eels migrating across the continental shelf to the Sargasso Sea. Nat Commun. 2015a;6 doi: 10.1038/ncomms9705. 8705. [DOI] [PMC free article] [PubMed] [Google Scholar]
- Béguer-Pon M, Castonguay M, Shan S, Benchetrit J, Dodson JJ. Direct observations of American eels migrating across the continental shelf to the Sargasso Sea. Nat Commun. 2015a;6 doi: 10.1038/ncomms9705. 8705. [DOI] [PMC free article] [PubMed] [Google Scholar]
- Béguer-Pon M, Shan S, Thompson KR, Castonguay M, Sheng J, Dodson JJ. Exploring the role of the physical marine environment in silver eel migrations using a biophysical particle tracking model. ICES J Mar Sci. 2015b;73:57–74. [Google Scholar]
- Béguer-Pon M, Ohashi K, Sheng J, Castonguay M, Dodson JJ. Modeling the migration of the American eel in the Gulf of St. Lawrence. Mar Ecol Prog Ser. 2016;549:183–198. [Google Scholar]
- Béguer-Pon M, Shan C, Castonguay M, Dodson JJ. Behavioural variability in the vertical and horizontal oceanic migrations of maturing American eels. Mar Ecol Prog Ser. 2017;585:123–142. [Google Scholar]
- Burgerhout E, Manabe R, Brittijn SA, Aoyama J, Tsukamoto K, Van den Thillart G. Dramatic effect of pop-up satellite tags on eel swimming. Naturwissenschaften. 2011;98:631–634. doi: 10.1007/s00114-011-0805-0. [DOI] [PMC free article] [PubMed] [Google Scholar]
- Chang Y-L, Miyazawa Y, Béguer-Pon M. Simulating the oceanic migration of silver Japanese eels. PLoS ONE. 2016;11(3):e0150187. doi: 10.1371/journal.pone.0150187. [DOI] [PMC free article] [PubMed] [Google Scholar]
- Chang Y-L, Miyazawa Y, Béguer-Pon M. The dynamical impact of mesoscale eddies on migration of Japanese eel larvae. PLoS ONE. 2017;12(3):e0172501. doi: 10.1371/journal.pone.0172501. [DOI] [PMC free article] [PubMed] [Google Scholar]
- Chow S, Okazaki M, Watanabe T, Segawa K. Light-sensitive vertical migration of the Japanese eel Anguilla japonica revealed by real-time tracking and its use for geolocation. PloS ONE. 2015;10(4):e121801. doi: 10.1371/journal.pone.0121801. [DOI] [PMC free article] [PubMed] [Google Scholar]
- Dou SZ, Yamada Y, Okamura A, Shinoda A, Tanaka S, Tsukamoto K. Temperature influence on the spawning performance of artificially matured Japanese eels Anguilla japonica in captivity. Env Biol Fish. 2008;82:151–164. [Google Scholar]
- Durif CMF, Browman HI, Phillips JB, Skiftesvik AB, Vøllestad LA, Stockhausen HH. Magnetic compass orientation in the European eel. PLoS ONE. 2013;8(3):e59212. doi: 10.1371/journal.pone.0059212. [DOI] [PMC free article] [PubMed] [Google Scholar]
- Dyment J, Lesur V, Hamoudi M, Choi Y, Thebault E, Catalan M. the WDMAM Task Force, the WDMAM Evaluators, and the WDMAM Data Providers, World Digital Magnetic Anomaly Map version 2.0. [accessed 29 March 2020]; http://www.wdmam.org.
- Ege V. A revision of the Genus Anguilla Shaw. Dana Reports. 1939;16:8–256. [Google Scholar]
- Gubili C, Schabetsberger R, Poellabauer C, Bates B. High genetic diversity and lack of pronounced population structure in five species of sympatric Pacific eels. Fish Manag Ecol. 2019;26:31–41. doi: 10.1111/fme.12287. [DOI] [PMC free article] [PubMed] [Google Scholar]
- Hammerschlag N, Skubel RA, Calich H, Nelson ER. Nocturnal and crepuscular behavior in elasmobranchs: a review of movement, habitat use, foraging, and reproduction in the dark. Bull Mar Sci. 2017;93:355–374. [Google Scholar]
- Higuchi T, Watanabe S, Manabe R, Kaku T, Okamura A, Yamada Y, Miller MJ, Tsukamoto K. Tracking Anguilla japonica silver eels along the West Mariana Ridge using pop-up archival transmitting tags. Zool Stud. 2018;57:24. doi: 10.6620/ZS.2018.57-24. [DOI] [PMC free article] [PubMed] [Google Scholar]
- Hill RD, Braun MJ. Geolocation by light level. The next step: latitude. In: Sibert JR, Nielsen J, editors. Electronic tagging and tracking in marine fisheries. Kluwer Academic Publishers, The Netherlands; 2001. pp. 315–330. [Google Scholar]
- Hughes DW, Yallop BD, Hohenkerk CY. The equation of time. Mon Nat R astr Soc. 1989;238:1529–1535. [Google Scholar]
- Hunt DM, Hart NS, Collin SP. Sensory Systems. In: Trischitta F, Takei Y, Sébert P, editors. Eel Physiology. CRC Press; Boca Raton: 2013. pp. 119–159. [Google Scholar]
- Hyslop NP, White WH. Estimating precision using duplicate measurements. J Air Waste Manage. 2009;59:1032–1039. doi: 10.3155/1047-3289.59.9.1032. [DOI] [PubMed] [Google Scholar]
- Jellyman DJ, Tsukamoto K. Vertical migrations may control maturation in migrating female Anguilla dieffenbachii . Mar Ecol Prog Ser. 2010;404:21–247. [Google Scholar]
- Jespersen P. Indo-Pacific leptocephalids of the genus Anguilla . Systematic and biological studies. Dana-Rep Carlsberg Foundation. 1942;22 [Google Scholar]
- Kuroki M, Aoyama J, Miller MJ, Watanabe S. Distribution and early life-history characteristics of anguillid leptocephali in the western South Pacific. Aust J Mar Freshwat Res. 2008;59:1035–1047. [Google Scholar]
- Kuroki M, Miller MJ, Tsukamoto K. Diversity of early life-history traits in freshwater eels and the evolution of their oceanic migrations. Can J Zool. 2014;92:749–770. [Google Scholar]
- Kuroki M, Miller MJ, Feunteun E, Sasal P. Distribution of anguillid leptocephali and possible spawning areas in the South Pacific Ocean. Prog Oceanogr. 2020;180 doi: 10.1016/j.pocean.2019.102234. 102234. [DOI] [PMC free article] [PubMed] [Google Scholar]
- Lohmann KJ, Lohmann CM, Endres CS. The sensory ecology of ocean navigation. J Exp Biol. 2008;211:1719–1728. doi: 10.1242/jeb.015792. [DOI] [PubMed] [Google Scholar]
- McCleave JD, Kleckner RC, Castonguay M. Reproductive sympatry of American and European eels and implications for migration and taxonomy. In: Dadswell MJ, Klauda RJ, Moffitt C, Saunders RL, Rulifson RA, Cooper JE, editors. Common strategies of anadromous and catadromous fishes. 1987. pp. 286–297. American Fisheries Society 1. Massachusetts. [Google Scholar]
- Methling C, Tudorache C, Skov PV, Steffensen JF. Pop-up satellite tags impair swimming performance and energetics of the European eel (Anguilla anguilla) Plos One. 2011;6:e20797. doi: 10.1371/journal.pone.0020797. [DOI] [PMC free article] [PubMed] [Google Scholar]
- Miller MJ, Feunteun E, Aoyama J, Watanabe S. Biodiversity and distribution of leptocephali west of the Mascarene Plateau in the southwestern Indian Ocean. Prog Oceanogr. 2015;137:84–102. [Google Scholar]
- Okamoto T, Kurokawa T, Gen K, Murashita K. Influence of salinity on morphological deformities in cultured larvae of Japanese eel, Anguilla japonica, at completion of yolk resorption. Aquaculture. 2009;293:113–118. [Google Scholar]
- Pelletier B, Auzende JM. Geometry and structure of the Vitiaz Trench Lineament (SW Pacific) Mar Geo Res. 1996;18:305–335. [Google Scholar]
- Price JF. Subduction. In: Siedler G, Church J, Gould J, editors. Ocean circulation and climate – Observing and modelling the global ocean. Academic Press; San Diego: 2001. pp. 357–371. [Google Scholar]
- Pujolar JM, Maes GE. Evolutionary genomics of North Atlantic eels – current status and perspectives. In: Arai T, editor. Biology and Ecology of Anguillid Eels. CRC Press; Boca Raton: 2016. pp. 36–51. [Google Scholar]
- Righton D, Aarestrup K, Jellyman D, Sébert P, van den Thillart G, Tsukamoto K. The Anguilla spp. migration problem: 40 million years of evolution and two millennia of speculation. J Fish Biol. 2012;81:365–386. doi: 10.1111/j.1095-8649.2012.03373.x. [DOI] [PubMed] [Google Scholar]
- Righton D, Westerberg H, Feunteun E, Økland F. Empirical observations of the spawning migration of European eels: The long and dangerous road to the Sargasso Sea. Sci Adv. 2016;2016(2):e1501694. doi: 10.1126/sciadv.1501694. [DOI] [PMC free article] [PubMed] [Google Scholar]
- Schabetsberger R, Økland F, Aarestrup K, Sichrowsky U. Oceanic migration behaviour of tropical Pacific eels from Vanuatu. Mar Ecol Prog Ser. 2013;475:177–190. [Google Scholar]
- Schabetsberger R, Økland F, Kalfatak D, Sichrowsky U. Sympatric spawning of tropical Pacific eels from Vanuatu. Mar Ecol Prog Ser. 2015;521:171–187. [Google Scholar]
- Schabetsberger R, Miller MJ, Dall’Olmo G, Kaiser R. Hydrographic features of anguillid spawning areas: potential signposts for migrating eels. Mar Ecol Prog Ser. 2016;554:141–155. doi: 10.3354/meps11824. [DOI] [PMC free article] [PubMed] [Google Scholar]
- Schmidt J. The breeding places of the eel. Phil Trans R Soc Lond. 1922;211:179–208. [Google Scholar]
- Sillar KT, Picton LD, Heitler WJ. The neuroethology of predation and escape. John Wiley & Sons; New York: 2016. [Google Scholar]
- Sørensen SR, Butts IAE, Munk P, Tomkiewicz J. Effects of salinity and sea salt type on egg activation, fertilization, buoyancy, and early embryology of European eel, Anguilla anguilla . Zygote. 2016;24:121–138. doi: 10.1017/S0967199414000811. [DOI] [PubMed] [Google Scholar]
- Tesch F-W. 3ed. Blackwell, Oxford; 2003. The eel. [Google Scholar]
- Tsukamoto K. Discovery of the spawning area for the Japanese eel. Nature. 1992;356:789–791. [Google Scholar]
- Tsukamoto K. Oceanic migration and spawning of anguillid eels. J Fish Biol. 2009;74:1833–1852. doi: 10.1111/j.1095-8649.2009.02242.x. [DOI] [PubMed] [Google Scholar]
- Tsukamoto K, Chow S, Otake T, Kurogi H. Oceanic spawning ecology of freshwater eels in the western North Pacific. Nat Commun. 2011;2:1–9. doi: 10.1038/ncomms1174. [DOI] [PMC free article] [PubMed] [Google Scholar]
- Unuma T, Sawaguchi S, Hasegawa N, Tsuda N, Tanaka T, Nomura K, Tanaka H. Optimum temperature of rearing water during artificial induction of ovulation in Japanese eel. Aquaculture. 2012;358(359):216–223. [Google Scholar]
- Walker MM, Dennis TE, Kirschvink JL. The magnetic sense and its use in long distance navigation by animals. Curr Opin Neurobiol. 2002;12:735–744. doi: 10.1016/s0959-4388(02)00389-6. [DOI] [PubMed] [Google Scholar]
- Westerberg H. Marine migratory behavior of the European silver eel. In: Ueda H, Tsukamoto K, editors. Physiology and Ecology of Fish Migration. CRC Press; Boca Raton: 2014. pp. 81–104. [Google Scholar]
- Westerberg H, Sjöberg NB, Lagenfelt I, Aarestrup K, Righton D. Behaviour of stocked and naturally recruited European eels during migration. Mar Ecol Prog Ser. 2014;496:145–157. [Google Scholar]
- Wysujack K, Westerberg H, Aarestrup K, Trautner J, Kurwie T, Nagel F, Hanel R. The migration behaviour of European silver eels (Anguilla anguilla) released in open ocean conditions. Mar Freshw Res. 2014;66:145–157. [Google Scholar]
Associated Data
This section collects any data citations, data availability statements, or supplementary materials included in this article.
Supplementary Materials
Variability of the temperature (A), salinity (B), and current field (C) at the median nighttime depth (± robust standard deviation, 174 ± 30 m) of Eel 1 (Anguilla marmorata) during its migration in the western South Pacific. The black circle and star are the departure and pop-up locations, respectively, and the triangle represents the position of the eel along its estimated migration route at each time step.
Variability of temperature (A), salinity (B), and current field (C) at the median nighttime depth (± robust standard deviation, 188 ± 45 m) of Eel 2 (Anguilla marmorata) during its migration in the western South Pacific. The black circle and star are the departure and pop-up locations, respectively, and the triangle represents the position of the eel along its estimated migration route at each time step.
Variability of temperature (A), salinity (B), and current field (C) at the median nighttime depth (± robust standard deviation, 177 ± 21 m) of Eel 3 (Anguilla megastoma) during its migration in the western South Pacific. The black circle and star are the departure and pop-up locations, respectively, and the triangle represents the position of the eel along its estimated migration route at each time step.
Variability of temperature (A), salinity (B), and current field (C) at the median daytime depth (± robust standard deviation, 653 ± 21 m) of Eel 1 (Anguilla marmorata) during its migration in the western South Pacific. The black circle and star are the departure and pop-up locations, respectively, and the triangle represents the position of the eel along its estimated migration route at each time step.
Variability of temperature (A), salinity (B), and current field (C) at the median daytime depth (± robust standard deviation, 806 ± 30 m) of Eel 2 (Anguilla marmorata) during its migration in the western South Pacific. The black circle and star are the departure and pop-up locations, respectively, and the triangle represents the position of the eel along its estimated migration route at each time step.
Variability of temperature (A), salinity (B), and current field (C) at the median daytime depth (± robust standard deviation, 758 ± 21 m) of Eel 3 (Anguilla megastoma) during its migration in the western South Pacific. The black circle and star are the departure and pop-up locations, respectively, and the triangle represents the position of the eel along its estimated migration route at each time step.


