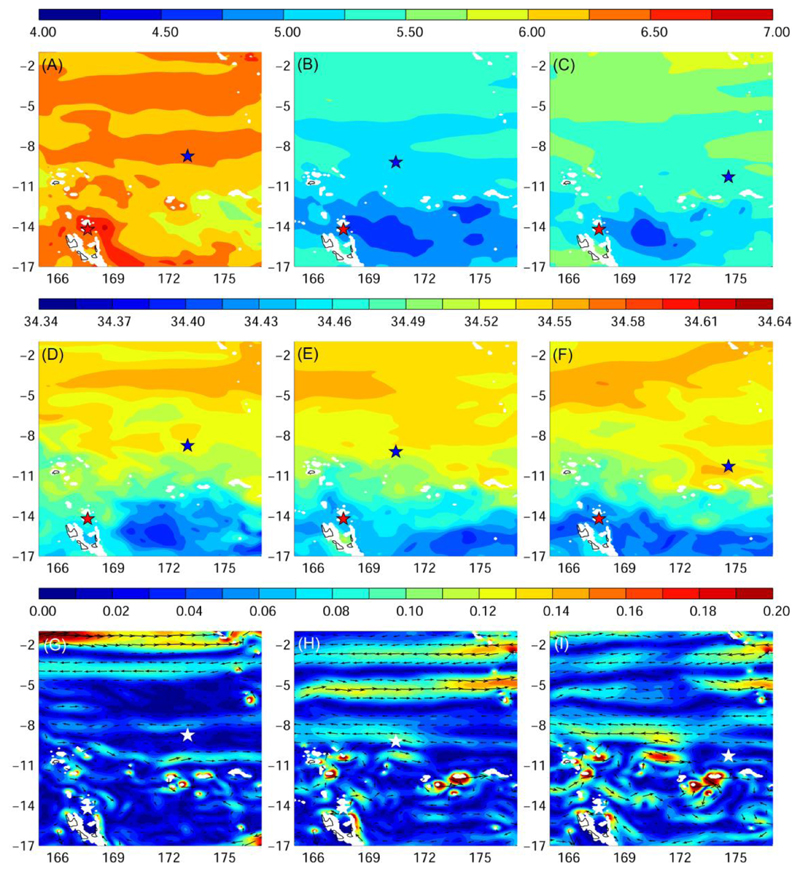
Fig. 7.
Average temperature (°C, A-C), salinity (D-F), and ocean current fields (m s-1, G-I) at median daytime migration depths of eels during their migration (± robust standard deviation; left: Eel 1, Anguilla marmorata, 653 ± 21 m; middle: Eel 2, Anguilla marmorata, 806 ± 30 m; right: Eel 3, Anguilla megastoma, 758 ± 21 m). Red and blue (or white) star represents release and pop-up location, respectively.

