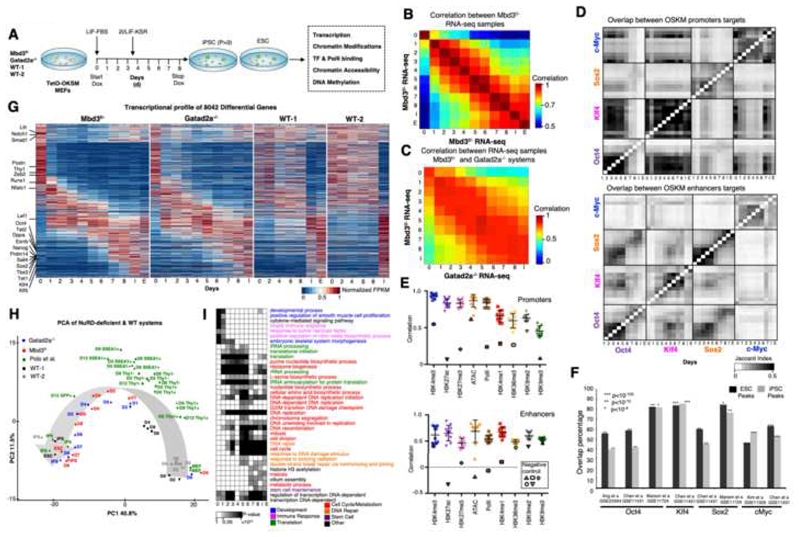
Fig. 1. Continuous and coordinated progression of conducive reprogramming in two independent NuRD-deficient systems.
A. Experimental scheme. B. Spearman correlation between expression profiles of Mbd3f/- system Calculated over all differential genes (n=8,042), showing an average correlation of R=0.93 between consecutive samples. C. As in B, but between Mbd3flox/- and Gatad2a-/- systems. D. Overlap between targets of OSKM in promoters and enhancers. Pixel shade indicates Jaccard Index. E. Correlation between consecutive samples in Mbd3f/- system (MEF-day1, day1-day2, day2..day8-iPS), measured over all ESPGs promoters (promoters with differential chromatin pattern, n=3,593, top), or all differential enhancers (n=40,174, bottom), for each chromatin mark. Negative controls were calculated between MEF and IPS, are marked with solid border. F. Overlap between binding targets of Oct4, Sox2, Klf4 or Myc, and previously published binding data of the same factors, calculated in ES and iPS samples. Percentage out of our measured binding targets is presented, along Fisher exact test p-values. G. Global transcriptional pattern of 8,042 differential genes (FC>4 & maximal FPKM value>1), sorted by their temporal pattern in Mbd3f/-system (the same gene order was applied for the other reprogramming systems). Heatmap represents unit-transformation of FPKM values. H. PCA analysis of all samples, alongside samples from previous publications (Polo et al., 2012). PCA was calculated on the same set of genes and normalization as in G. I. GO categories enriched among the genes that are active in each day. Gene is defined to be active in samples where RPKM is above 0.5 of the gene max value. P-values were calculated with Fisher exact test, and FDR corrected. Categories with corrected p-value<0.01 in at least two-time points are presented. Gray Shades represent FDR corrected p-values

