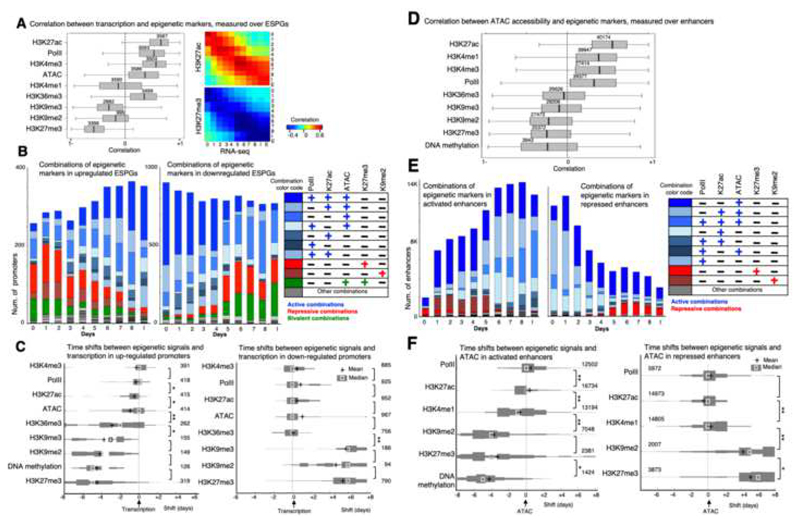
Fig. 5. Mapping the order of epigenetic events that drive transcription initiation and repression.
A. Left: Correlation between each of the indicated chromatin modifications and gene expression patterns that were measured in the promoters of ESPGs that have the modifications (numbers are indicated). Correlations were calculated for each gene, over 11 time points. H3K27ac, PolII and H3K4me3 show positive correlation with gene expression, while H3K27me3 and to lesser extent H3K9me2,3 show negative correlation with expression. Right: Correlation matrix over all ESPGs, between H3K27ac or H3K27me3 and gene expression (RPKM) for each sample separately. B. Stacked bar chart of all combinations of the indicated chromatin modifications, as measured in promoters of upregulated ESPGs (left) and downregulated ESPGs (right). Right – color code of frequent combinations (>3% of each sample). C. Distribution of time shifts between each of the indicated epigenetic modification and gene expression profile, measured using cross correlation. The distribution, presented as histogram, was measured over upregulated ESPGs (Left) and downregulated ESPGs (right) which have a changing epigenetic modification (max-min z-score > 0.5). The number of promoters tested is indicated. X-axis indicates the temporal time shift in days. Plus indicates mean, and square indicates median. *p<10-5, **p<10-25 (Wilcoxon test). D. Correlation between each of the indicated chromatin modification and DNA accessibility patterns that were measured in all differential enhancers that have the modifications (numbers are indicated). Correlations were calculated over 11 time points. E. Stacked bar chart of all combinations of the indicated chromatin modifications, as measured in activated enhancers (left) and in repressed enhancers (right). Right – color code of frequent combinations (>3% of each sample). F. Distribution of time shifts between each of the indicated epigenetic modification and accessibility profile, measured using cross correlation. The distribution, presented as histogram, was measured over activated enhancers (Left) and repressed enhancers (right) which have a changing epigenetic modification (max-min z-score > 0.5). The number of enhancers tested is indicated. X-axis indicates the temporal time shift in days. Plus indicates mean, and square indicates median. * p<10-4, ** p<10-50 (Wilcoxon test).

