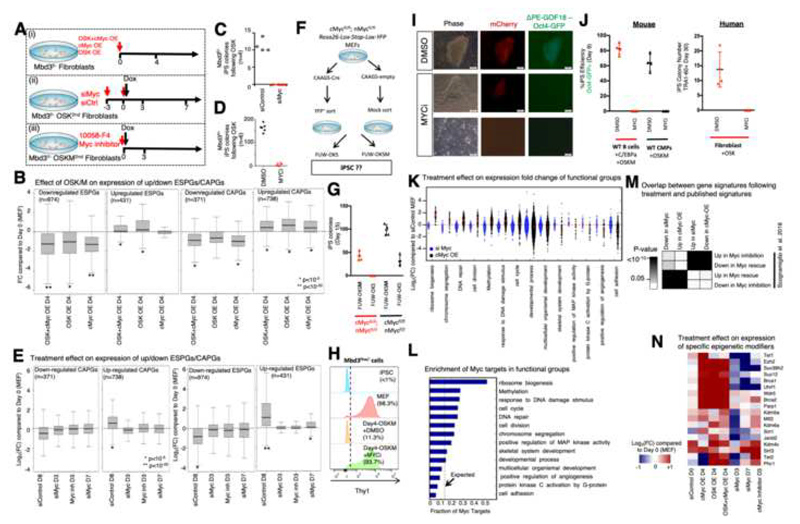
Fig. 6. Biosynthetic processes are regulated by Myc activity.
A. Experimental flow describing three experimental perturbation settings: (i) Mbd3f/- MEFs were virally infected with cMyc over-expression (OE) cassette, OSK-OE cassette or both cassettes. Gene expression was measured on day4 following infection. (ii) Mbd3f/- MEFs carrying OSK Dox-dependent cassette were treated for knockdown of c-Myc, n-Myc and l-Myc. Gene expression was measured on days 3 and 7, and colony formation was measured on day 11. (iii) Mbd3f/- MEFs carrying OSKM Dox-dependent cassette were treated with inhibitor of cMyc (10058-F4) and with Dox. Gene expression and colony formation were measured on day 3. B. Distribution of Expression fold change (FC) compared to WT MEF of up/down regulated ESPGs (down regulated ESPGs are enriched for somatic genes), and CAPGs. Presented perturbations are over-expression of OSK cassette, over-expression of c-Myc cassette, or over-expression of the two cassettes together. (*p<10-5, **p<10-20, Wilcoxon test). C-D. Reprogrammed colony formation in Myc knockdown ort small molecule inhibition, measured 11-14 days after Dox. E. Distribution of expression fold change (FC, in log2 scale) compared to MEF of up/down regulated ESPGs and CAPGs. Presented perturbations are Myc knockdown, inhibition of Myc activity with small molecular inhibitor (10058-F4). (*p<10-5, **p<10-20, Wilcoxon test). F. Experimental scheme. G. IPSC Reprogramming efficiency in different cells expressing both endogenous and/or exogenous cMyc and nMyc. H. FACS analysis for surface expression of fibroblast surface marker Thy1 on the indicated Mbd3flox/- cell types. Dotted line indicates positive threshold for detection. I. Representative pictures of Mbd3fl/- cells harboring mCherry-NLS and ΔPE-GOF18 Oct4-GFP cassettes after 13 days of reprogramming in the presence of MYCi. Scale = 100μM. J. Left panel - iPSC reprogramming efficiency by applying highly efficient mouse B cell and WT CMP reprogramming protocols by OSKM in the presence or absence of MYC small molecule inhibitor (MYCi). Right panel – Human iPSC reprogramming efficiency by applying OKS lentiviral transduction in the presence of absence of MYCi. K. Expression fold-change distribution (log2 scale) of selected GO categories in Myc over-expression or Myc knockdown, showing that upon over-expression of Myc, processes such as ribosomal biogenesis and chromosome segregation are induced. L. Fraction of Myc targets in significantly induced and repressed GO categories, compared to what is expected by random (dashed line). M. Overlap between differential genes detected in Myc perturbation experiments, and differential genes detected in previous published perturbations (Scognamiglio et al., 2016). Fisher exact test p-values are presented. N. Expression fold change of selected chromatin modifiers.

