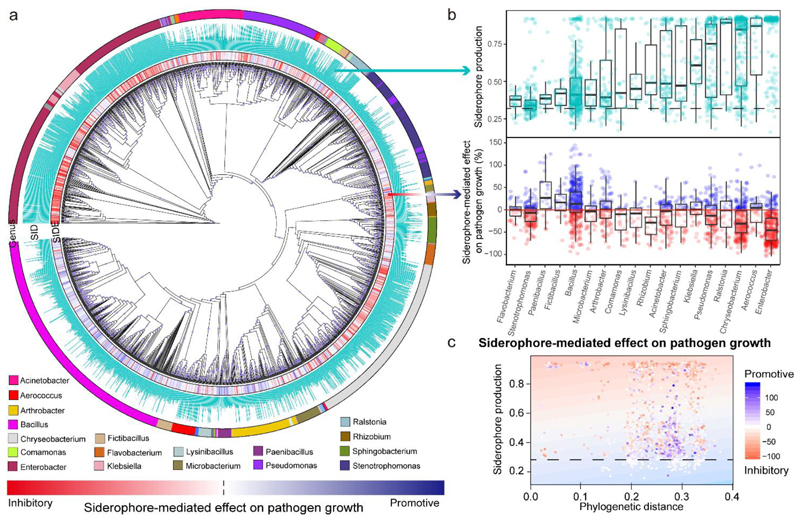
Fig. 2. Taxa identity of rhizobacterial isolates and their phylogenetic distance to R. solanacearum affect siderophore-mediated growth effects on the pathogen.
a, Cladogram depicting the phylogenetic relationship among the 2,150 isolates based on the 16S rRNA gene sequences. The first inner ring depicts the siderophore-mediated growth effects on the pathogen as a heatmap ranging from red (inhibitory) to blue (promotive), the second ring shows relative siderophore production by each isolate and the outer ring shows the most abundant genera (number of isolates greater than 20). SIDE, siderophore-mediated effect on pathogen growth; SID, siderophore production. b, Variation among isolates of the 18 most prevalent genera with regard to siderophore production (top) and siderophore-mediated effect on pathogen growth (bottom). The black dashed line shows the background CAS assay values of siderophore non-producers under iron-limited conditions. Values above and below the red line represent siderophore-mediated promotive and inhibitory effects of rhizobacteria on the pathogen growth. The exact number of bacteria in each genus is shown in Supplementary Table 7. The box plots encompass the 25–75th percentiles, the whiskers extend to the minimum and maximum points, and the midline indicates the median. c, Relationship between the siderophore-mediated effect on pathogen growth, phylogenetic distance between the pathogen and rhizosphere bacteria, and siderophore production in iron-limited conditions. This relationship explained a high proportion of the observed variance (25.6%) in iron-limited conditions (visualized as a heatmap based on the generalized linear model analysis, background). The dotted lines represent the background CAS assay values of defined siderophore non-producers. Each point represents one of the 2,150 isolates and its colour shade indicates the strength of the siderophore-mediated effect on pathogen growth (adjusted R 2 = 0.255, F 1,1248 = 87.7 and two-sided P < 2.2 × 10⁻¹⁶ based on Student’s t-tests for the whole model).

