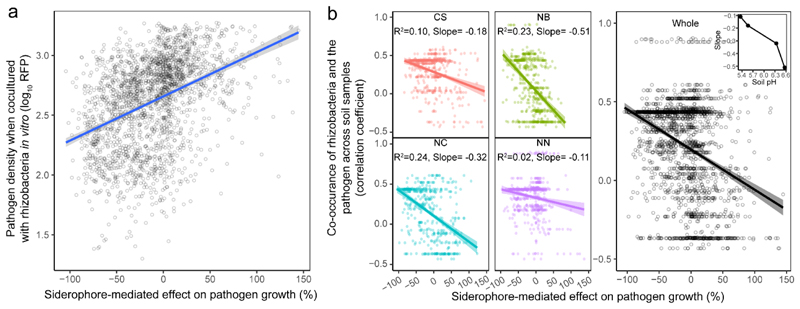
Fig. 3. Siderophore-mediated effects on pathogen growth correlate with R. solanacearum and rhizosphere bacterial abundances in vitro and in vivo under field conditions.
a, Co-culture experiments between the R. solanacearum pathogen and each of the 2,150 rhizosphere isolates show that pathogen density (measured as mCherry fluorescence units) correlates positively with siderophore-mediated growth effects, suggesting that siderophores determine pathogen growth when in direct competition with rhizosphere bacteria. The blue line and grey shaded area depict the best-fit trendline and the 95% confidence interval of the linear regression, respectively (adjusted R 2 = 0.16, n = 2,150 biologically independent rhizobacterial isolates, F 1,1248 = 404.6 and two-sided P < 2.2 × 10⁻¹⁶ based on a Student’s t-test). b, Co-occurrence between the pathogen and rhizosphere bacteria was estimated as the correlation coefficient across the 80 soil samples and plotted against the effect of siderophores on pathogen growth. Exclusively negative correlations were found between these variables, showing that rhizosphere bacteria producing inhibitory siderophores tended to coexist at high densities with the pathogen (positive r), whereas isolates producing promotive siderophores tended to occur at low densities when the pathogen was abundant (negative r). Inset, the strength of this relationship correlated with the soil pH at the four sampling sites (right). Left, the colours represent different sampling sites: CS, Changsha (n = 528 biologically independent rhizobacterial isolates, F 1,526 = 58.72, P < 2.2 × 10⁻¹⁶); NB, Ningbo (n = 526 biologically independent rhizobacterial isolates, F 1,524 = 154.1, P < 2.2 × 10⁻¹⁶); NC, Nanchang (n = 508 biologically independent rhizobacterial isolates, F 1,506 = 157.1, P < 2.2 × 10⁻¹⁶); NN, Nanning (n = 568 biologically independent rhizobacterial isolates, F 1,566 = 14.9, P = 0.0001). The results of linear regression analysis in the left panel are shown as colour-coded best-fit trendlines for each sampling site (the shaded areas depict the 95% confidence interval and adjusted R 2 with the slope of the best-fit trendlines). Right, adjusted R 2 = 0.133 and the shaded area depicting the 95% confidence interval are shown (n = 2,130 biologically independent rhizobacterial isolates, F 1,1228 = 272.7 and two-sided P < 2.2 × 10⁻¹⁶ based on Student’s t-tests for the whole data across four sampling sites).

