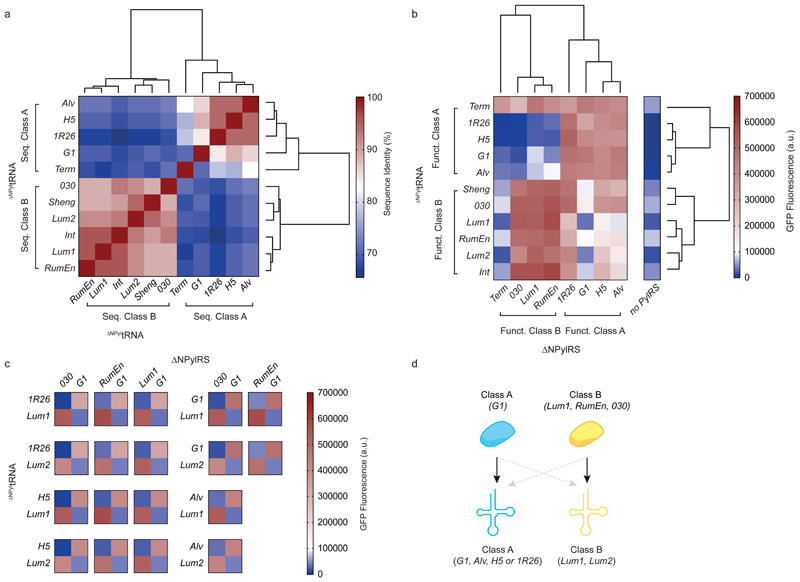
Figure 1. Identifying two classes of ΔNPylRS/ΔNPyltRNA pairs and 18 naturally mutually orthogonal ΔNPylRS/ΔNPyltRNA pairs.
a, Hierarchical clustering of ΔNPyltRNAs with sequence similarity scores converted to Euclidean distance measures and complete linkage clustering (determined using the program R Studio). Percentage sequence identity scores are displayed as a heatmap. The dendrograms resulting from the clustering show the groupings of the ΔNPyltRNAs into two sequence-dependent classes. b, Hierarchical clustering of the indicated ΔNPylRS/ΔNPyltRNACUA pairs on the basis of GFP fluorescence (that is, the resulting expression of GFP(150TAG)His6 in presence of BocK 1) converted to Euclidean distance measures and complete linkage clustering (determined using the program R Studio). Bar charts showing the number of replicates and error bars showing s.d. are provided in Supplementary Fig. 6. All numerical values are provided in Supplementary Table 3. The dendrograms resulting from the clustering show the groupings of the ΔNPyltRNAs and ΔNPylRS into two function-dependent classes. Funct.,functional. c, Heatmaps displaying the in vivo amber suppression data as described in b for the 18 mutually orthogonal pairs. d, Schematic indicating naturally mutually orthogonal ΔNPylRS/ΔNPyltRNA pairs. Class A synthetases and tRNAs are in blue, class B synthetases and tRNAs are in yellow. Black arrows indicate high activity and dashed grey arrows indicate minimal activity corresponding to functional orthogonality.

