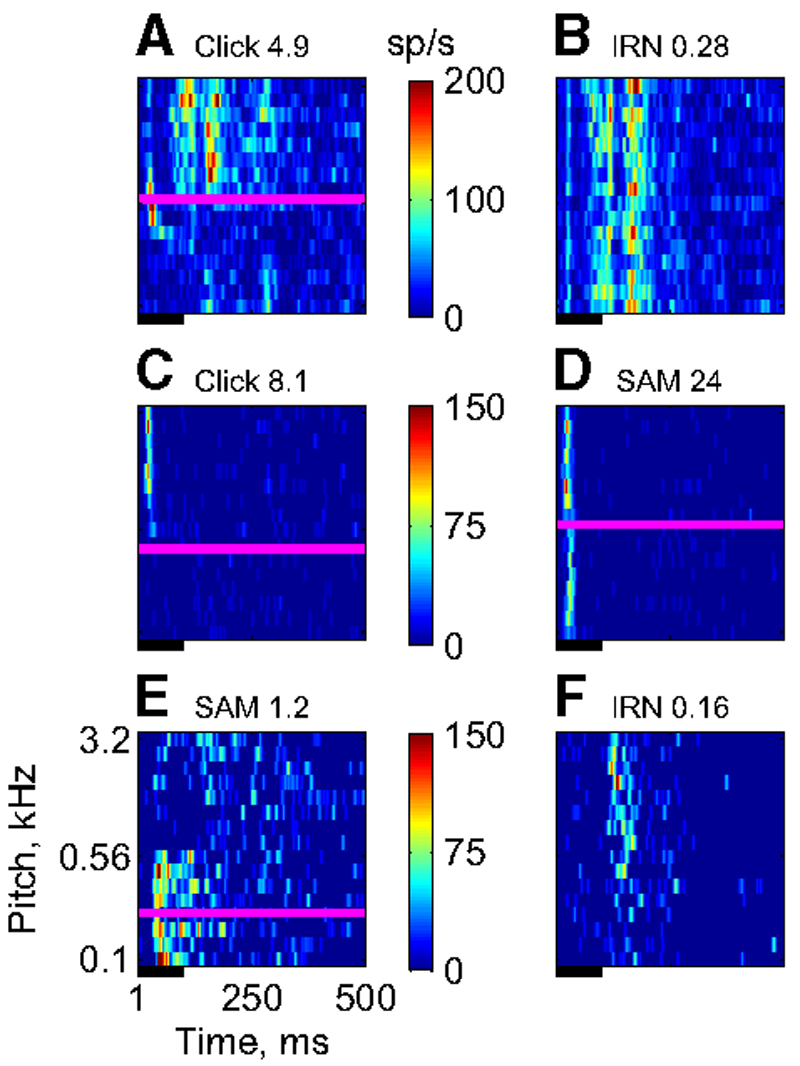
Fig. 5.
Comparison of electrophysiological and optical responses. The color maps give multiunit spike rates as a function of stimulus pitch (y-axis) and time poststimulus onset (x-axis). The horizontal magenta lines indicate the trigger pitch of the optical signal at the corresponding location, for those cases in which the RMF had significant modulation. The number in the title is the F value for the RMF recorded at the electrode location earlier in the same experiment. The black lines indicates stimulus duration. A and B: responses of the same multiunit cluster to high-pass click trains (A) and high-pass IRN (B). C and D: responses of another cluster to high-pass click trains (C) and SAM tones (D). E and F: responses of a third cluster to SAM tones (E) and high-pass IRN (F).

