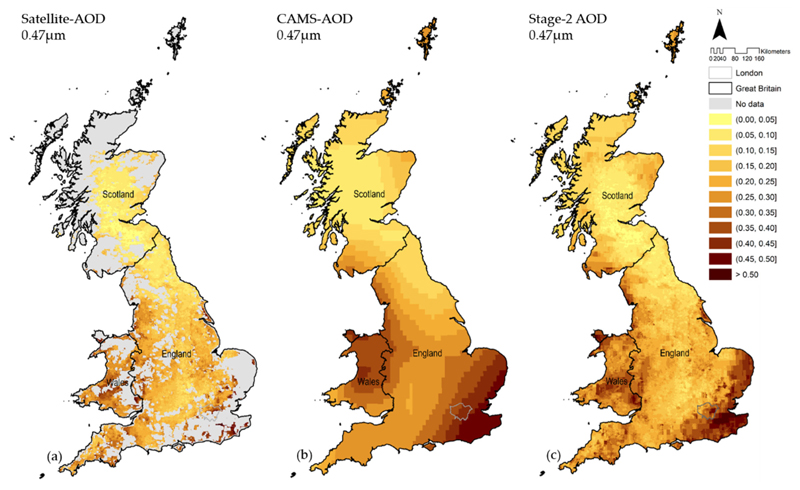
Figure 2.
Satellite-AOD 0.47 μm values are represented in Figure 2a (mean of all Terra- and Aqua-MODIS passing times). The missing values in grey were imputed through a combination of multiple modelled-AOD wavelengths and sub-day times, represented in Figure 2b by modelled-AOD 0.47 μm at 12:00. The Stage-2 output is shown in Figure 2c, illustrating the full coverage of AOD 0.47 μm based on the combination of measurements and estimations across Great Britain. The maps correspond to values measured or reconstructed on 6 July 2018.

