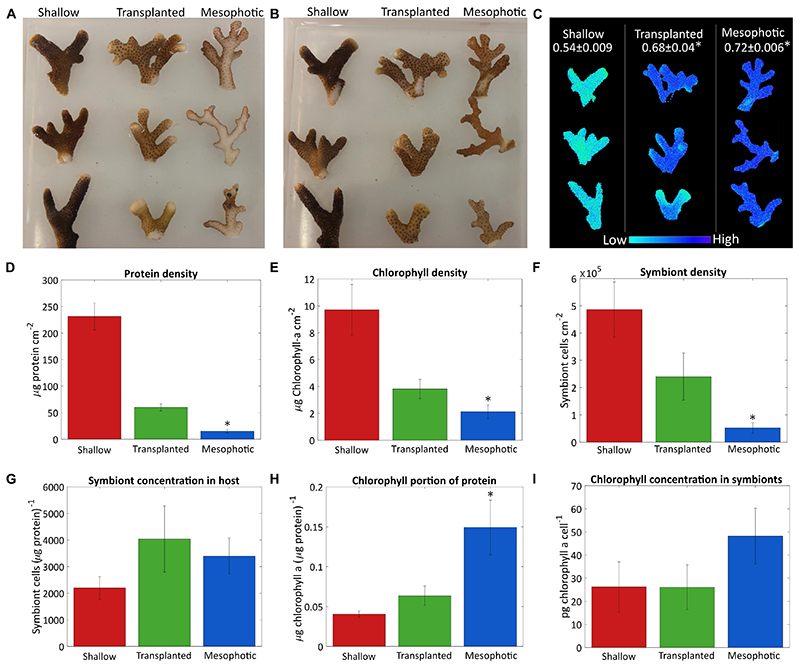
Figure 1.
Algae coverage and chlorophyll content. Three fragments from each colony were sampled after 18 months from the shallow corals (red), transplants from mesophotic to shallow (green), and mesophotic corals (blue). Photos of (A) the upper side of the fragments which faces the water surface and (B) the bottom side of the fragments, which faces the seabed. (C) Maximal photosystem II quantum yield (Fv/Fm) obtained by Imaging-PAM, measured on the upper side of the fragments. Average values for each colony are given at the top. (D) Total protein per surface area. (E) Surface density of chlorophyll a. (F) Number of symbiont cells per area. (G) Number of symbiont cells per total protein. (H) Chlorophyll a ratio to total protein. (I) Cellular chlorophyll a concentration in the symbiont cells. Error bars of (D-I) showing the standard error of the mean, n = 4. Asterisks (*) indicate statistical differences relative to shallow colonies.

