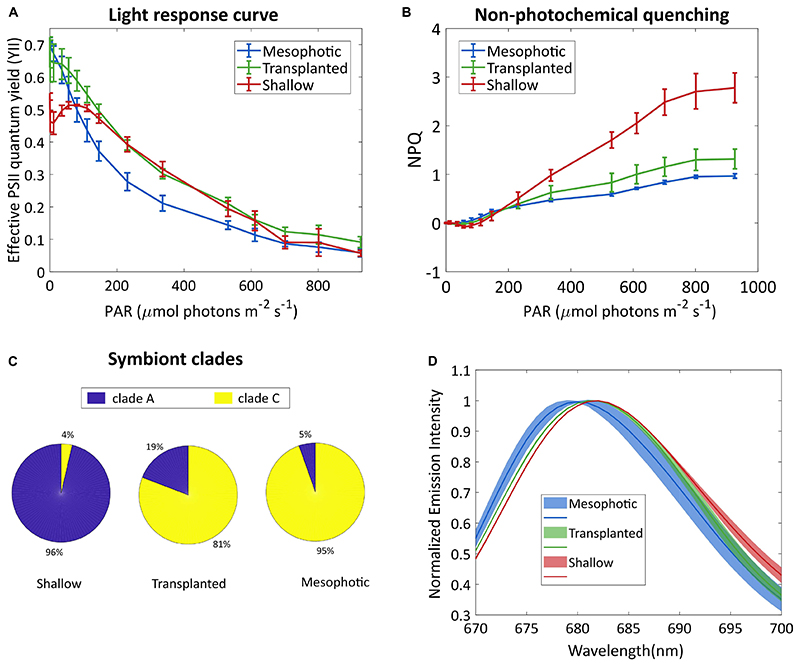
Figure 2.
Symbionts analysis. (A) Effective photosystem II quantum yield of the symbionts and (B) non-photochemical quenching, under different irradiances. Error bars show SD of three different fragments. (C) Symbiont clade composition 18 months after the reciprocal transplant. SD values are ±1, ±7, and ±1.7% for the shallow, transplanted and mesophotic groups, respectively. (D) Fluorescence spectra of the symbionts, following excitation at 475 nm. Lines show averaged spectra, the shaded area represents the SD (n = 3).

