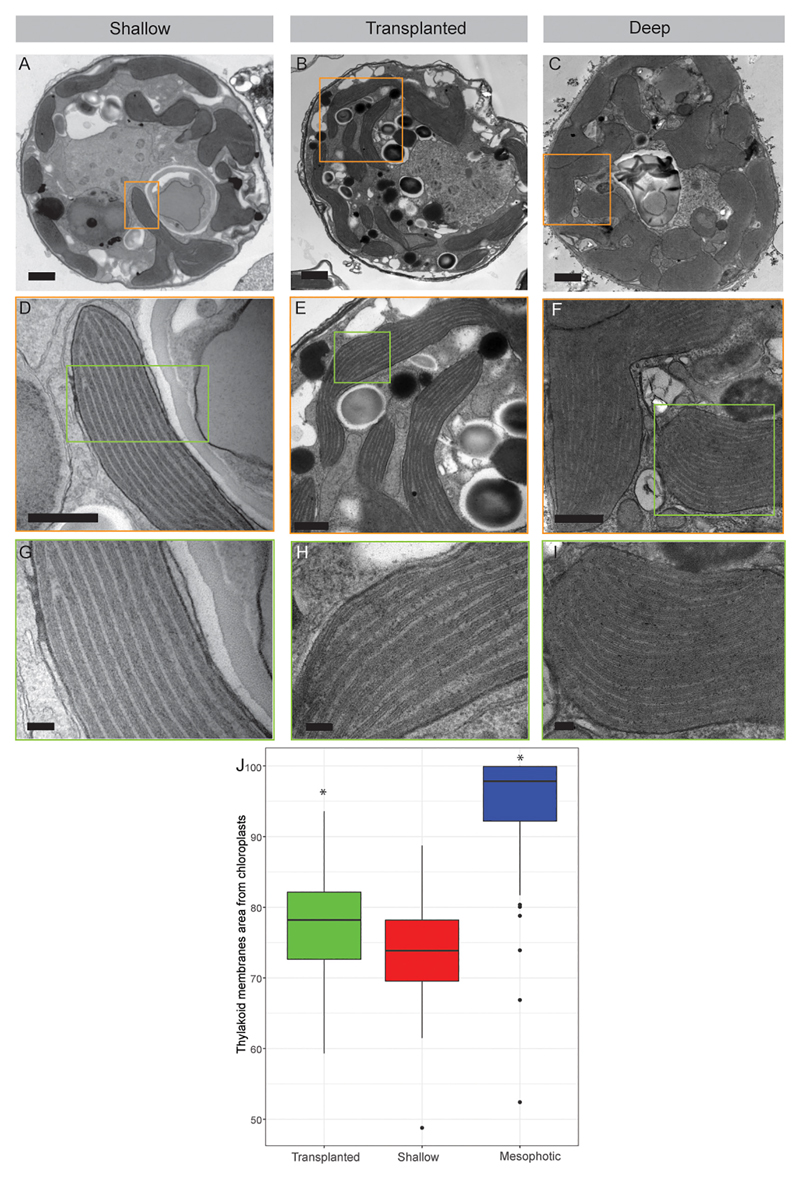
Figure 3.
Transmission electron microscopy of symbiont cells. (A-C) Whole cell view of the symbiont cells from shallow, transplanted and mesophotic colonies. (D-F) High magnification of the chloroplasts delimited by the orange box in (A-C). (G-I) High magnification of the thylakoid membranes view delimited by the green box in (D-F). (J) The thylakoid membranes area from chloroplasts is 74 ± 7% in shallow corals, 78 ± 7% in transplanted corals and 95 ± 8% in mesophotic corals. Scale bars: 1 μm (A-C), 500 nm (D-F), 100 nm (G-I). Asterisks (*) indicate statistical differences relative to shallow colonies.

