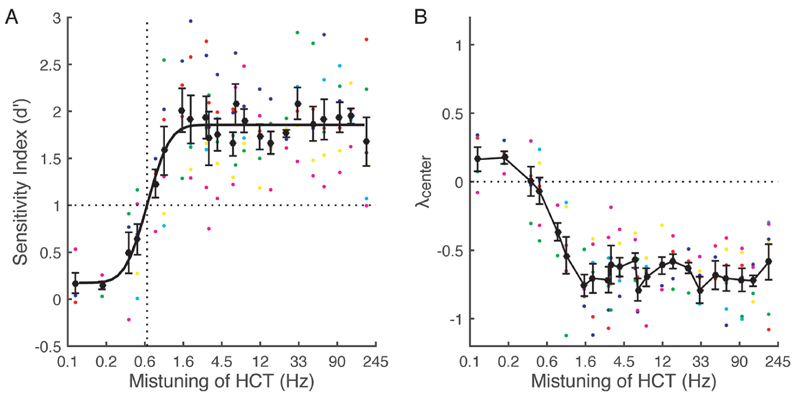
Fig. 1.
(Color online) Psychometric function for mistuning detection and response bias. Large black circles represent the mean (± standard error of the mean) across all animals (n = 6), while smaller color circles represent values for individual animals. (A) d′ as a function of mistuning (on a log scale) of the fourth harmonic of a harmonic complex tone (HCT). A cumulative Gaussian distribution was used to fit the psychometric function. The vertical dotted line indicates the mean threshold using a criterion of d′ =1. (B) The response bias measure λcenter as a function of mistuning. The horizontal dotted line indicates the value for no bias.

