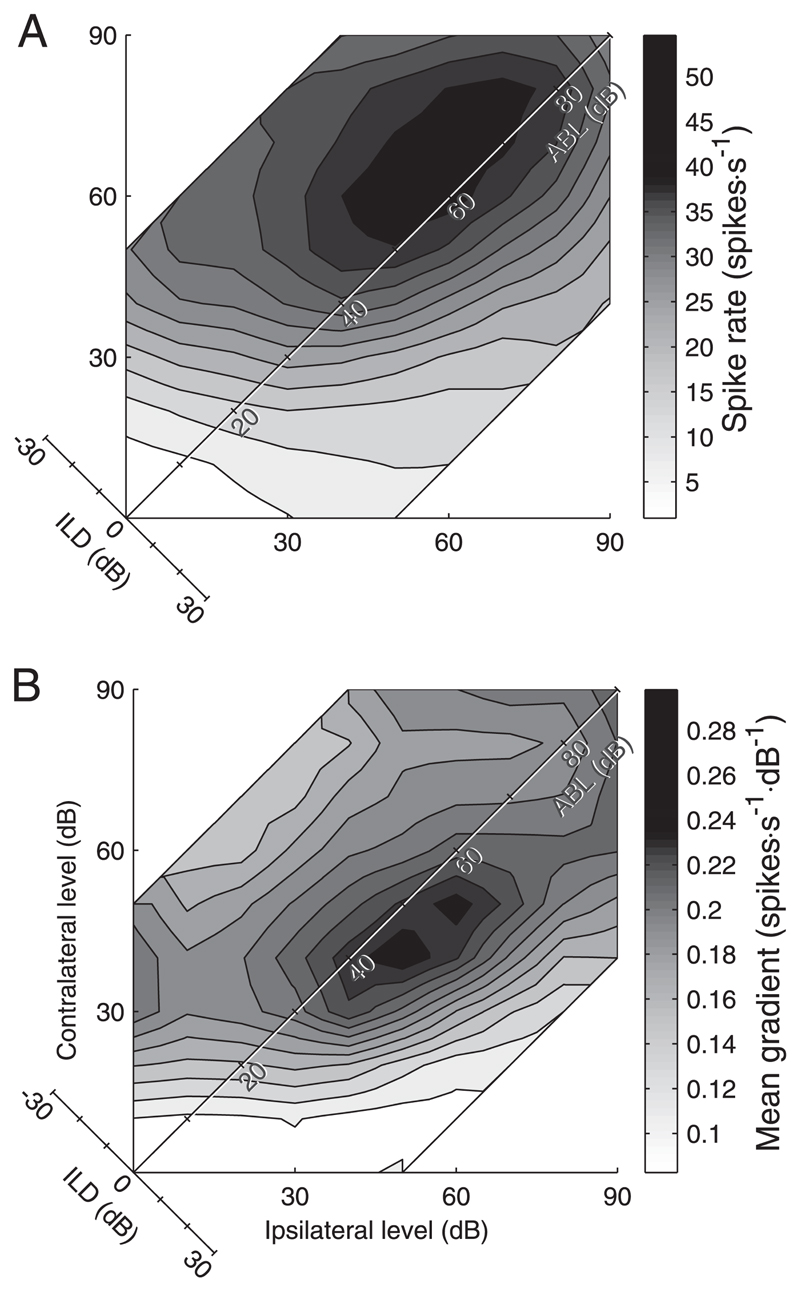
Fig. 15.
A: mean binaural response function over all 310 units. B: regions of greatest slope of the normalized response functions over the whole population. Each function was smoothed and normalized by the maximum response before calculation of the gradient. Gray scale indicates mean of the magnitude of the gradient at each point over all units. Region of greatest slope is elongated along the ABL axis, slightly ipsilateral to midline ILDs.

