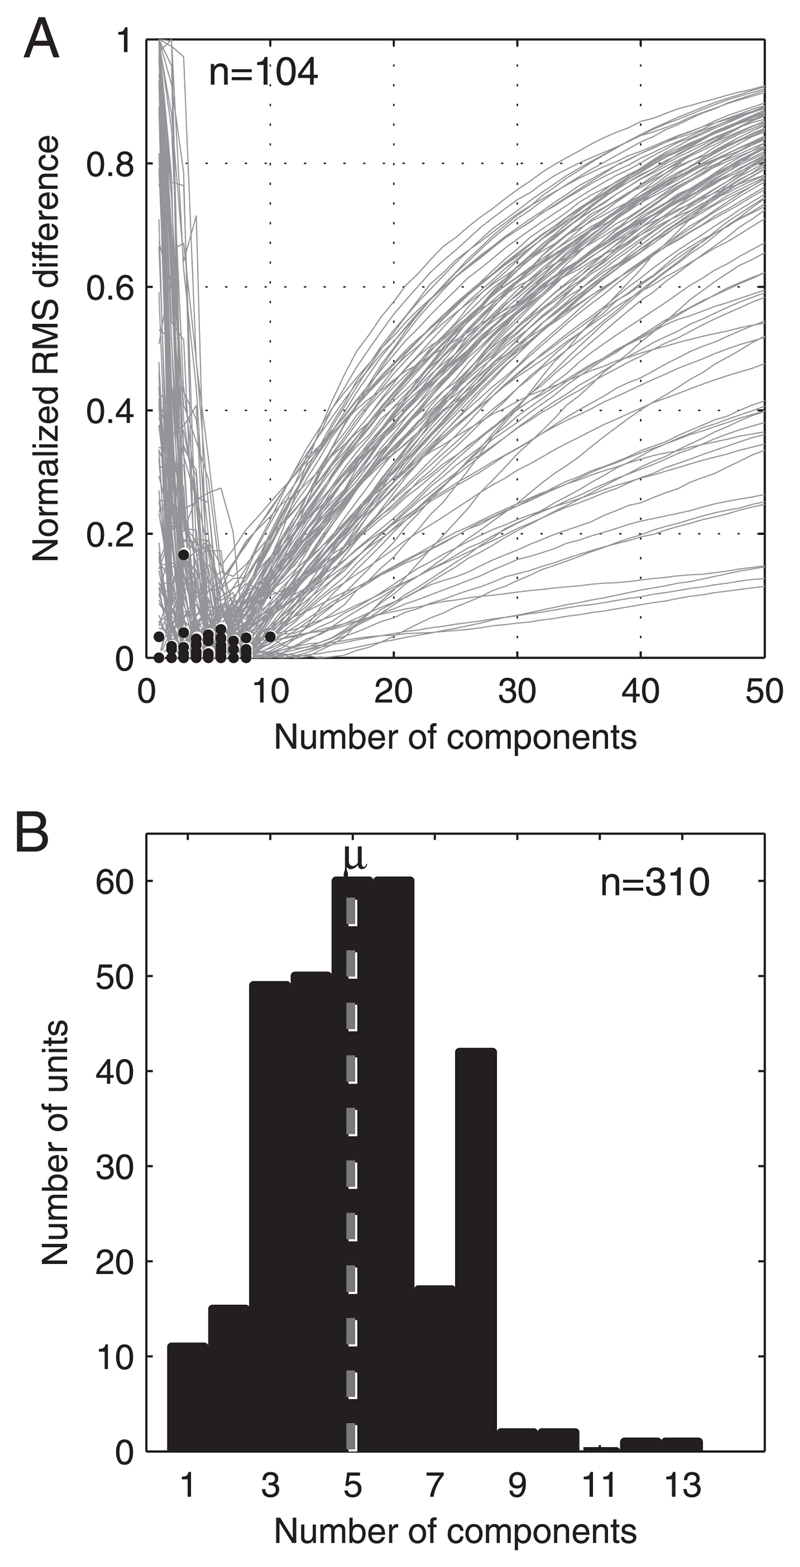
Fig. 6.
Plots summarizing the results of the permutation test that estimates the number of components required to model our data. A: normalized root-mean-square (RMS) of the residuals (calculated from 1,000 randomly selected training and test populations) between principal components analysis (PCA) models of increasing order and the test data (see methods). Black circles indicate the last component to provide a significant decrease in RMS error according to a one-tailed t-test (P ≤ 0.01). A random selection of 104/310 neurons is shown and curves are normalized to aid comparison. B: distribution of t-test results from all 310 units showing the number of components that can be added before overfitting occurs. Mean of this distribution (rounded to the nearest whole number) is 5 components. Models with 4–6 components are optimal for 55% of units.

