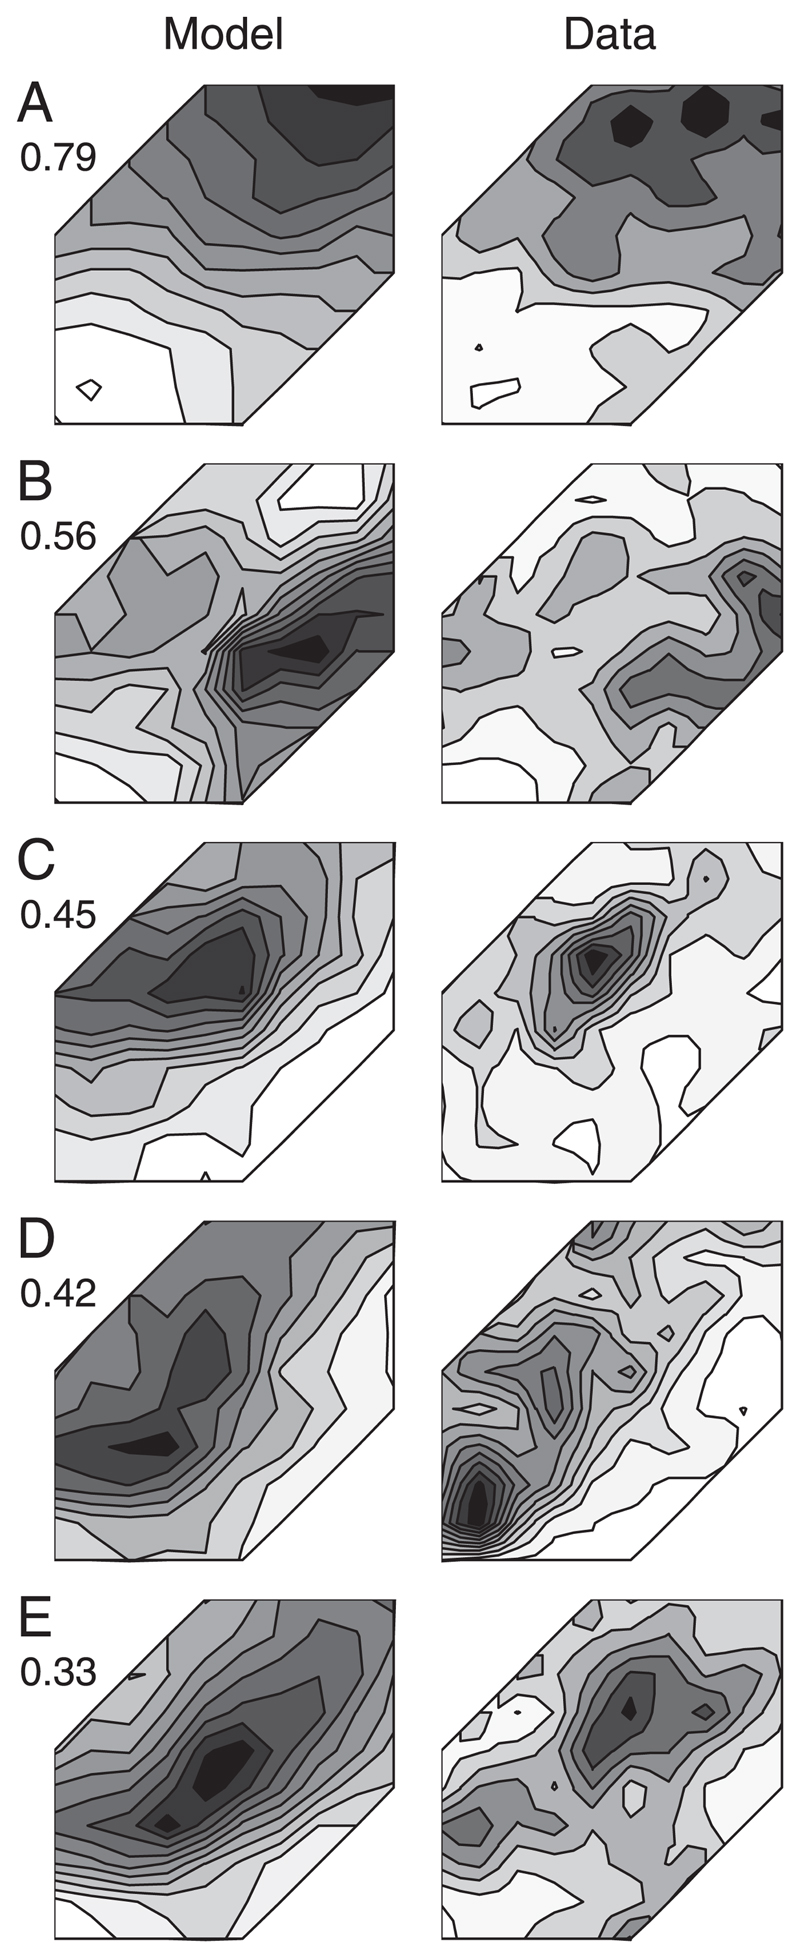
Fig. 8.
A–E: examples of 5 units showing the data as mean evoked spike rates (right column) and the corresponding 5-component PCA model (left column). Proportion of the variance explained by the model is indicated to the left of each modeled response. This figure highlights the units for which a low proportion of the variance was explained, thereby demonstrating that the model captured the underlying response shapes even if the variance explained appears low. Axes go from 0 to 90 dB SPL and are the same as those in Fig. 3. Modeled surfaces are not smoothed, whereas raw data have been smoothed as described in Fig. 2.

