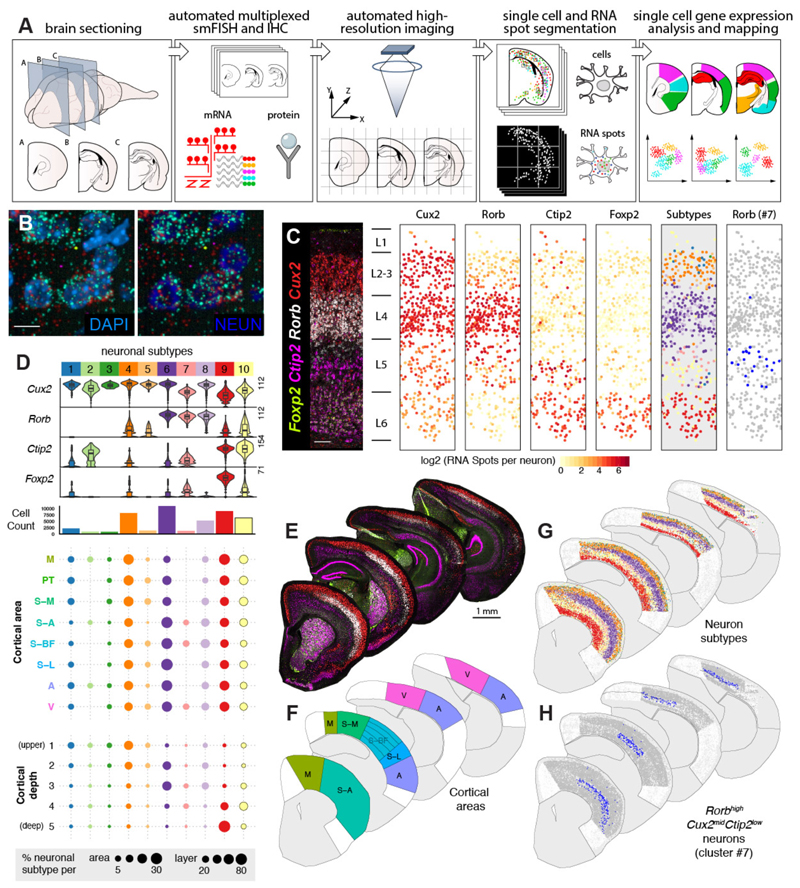
Figure 1. LaST map pipeline for mapping cortical neuronal subtypes in situ.
A) Design of automated spatial transcriptomic pipeline.
B) High resolution imaging of large tissue areas. Shown are 40X z-projection images of Rorb + L4 neurons in the P14 mouse barrel cortex.
C) Automated mapping of layer neuron marker expression and layer neuron subtypes in the mouse barrel cortex. Automatically identified single neurons are plotted as solid circles and colored according to expression (middle panels) or subtype classification (right panels).
D) Identification of neuronal subtypes based on unbiased classification of single cell level smFISH data. tSNE and hierarchical clustering of 46,888 cortical neurons yielded 10 subpopulations. (Top) Violin plots show single cell expression profiles of clusters, highest RNA spot count per cell are shown on the left. (Middle) Histograms showing total number of cells per cluster. (Bottom) Spatial distribution of clusters across cortical areas and five normalized cortical depth bins, shown as percentage of total neurons in given area/depth bin (bottom).
E-H) Single cell mapping of cortical neuron subtypes: (E) Low magnification images of P14 hemisections from four different anatomical levels, (F) broad cortical areas included in the analysis, (G) maps of 10 major neuronal populations, and (H) spatial distribution of area-restricted L5 Rorb high Cux2 mid Bcl11b low neurons.
n = 1 mouse, 10 tissue sections independently imaged. Scalebars: (B) 10 µm, (C) 100 µm, (E) 1 mm.
Abbreviations: M, motor, S-A, anterior- somatosensory, S-M, medial-somatosensory, S-BF, somatosensory barrel, S-L, somatosensory-lateral, PT, parietal, A, auditory, V, visual.

