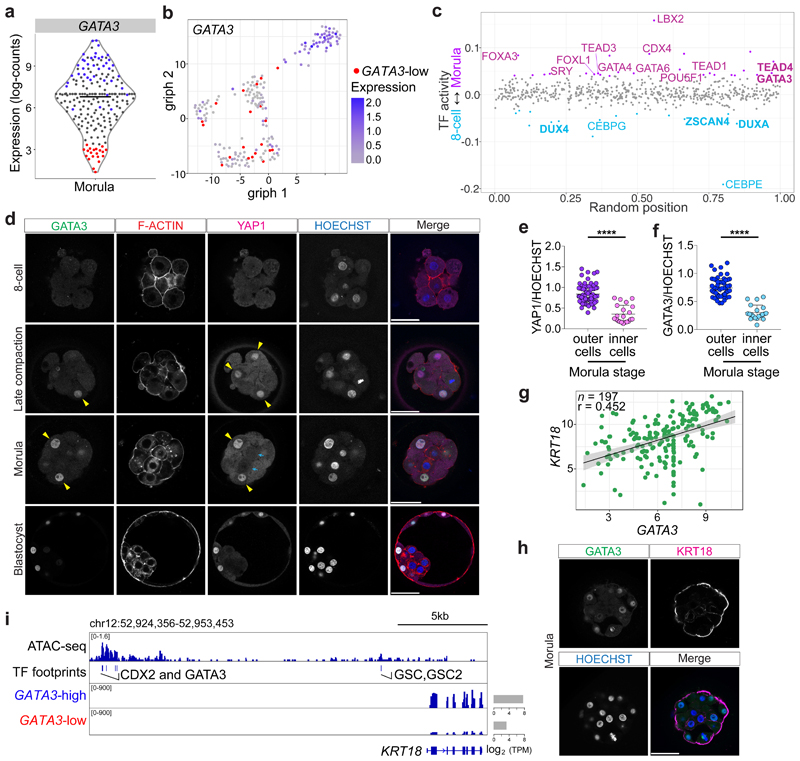
Fig. 1. Transcriptional and protein expression differences between cells at the morula stage in human embryos.
a, Violin plot showing log-transformed size-factor-normalized expression of GATA3 in human morula cells. n = 197 cells. Black line corresponds to the median. Red highlights cells with lowest GATA3 expression and in blue are cells with high GATA3 expression. b, Graph interference of population heterogeneity dimensionality reduction analysis of human morula cells. Single cells colored with the log-transformed size-factor-normalized expression of GATA3. c, ATAC-seq chromatin accessibility in human embryos at the morula stage compared to the 8-cell stage. Examples of transcription factors with a significant change in activity score (p < 0.05) are highlighted in purple in the morula and in cyan in the 8-cell stage. d, Time-course immunofluorescence analysis of GATA3 (green), F-ACTIN (red), YAP1 (magenta) and HOECHST-33342 nuclear staining (blue) in human embryos at pre-compaction (n = 5), late compaction (n = 5), morula (n = 10), expanded blastocyst (n = 4) stages. e, f, Quantification of YAP1 (e) and GATA3 (f) fluorescence intensity, normalized to HOECHST-33342 intensity, in either inner or outer cells in human morula embryos (n = 95 cells for YAP1 and n = 79 for GATA3 from 10 embryos). t-test for YAP1 distribution, ****p < 0.0001; Mann-Whitney U test for GATA3 distribution, ****p < 0.0001. Yellow arrowheads point to outer cells expressing YAP1 and GATA3, cyan arrows mark inner cells lacking detectable YAP1 and GATA3 expression. g, Scatter plots showing positive correlation of GATA3 and KRT18 expression profile in human morula cells. n = 197 cells. r = Pearson correlation coefficient. Values displayed as log-transformed size-factor-normalized counts. The black line corresponds to a linear regression model fitted to the data with 95% confidence bands. h, Immunofluorescence analysis of GATA3 (green), KRT18 (magenta) and DAPI nuclear staining (blue) in human morula stage embryos (n = 3). i, Genome browser view of the ATAC-seq signal at the KRT18 locus. High confidence peaks (FDR < 0.001) were used to identify transcription factor motifs. Representative binding motifs associated with the footprints are highlighted. The average expression of KRT18 in high GATA3-high and GATA3-low expressing cells at the morula is shown and the TPM units indicated. Scale bars, as displayed in figures.

