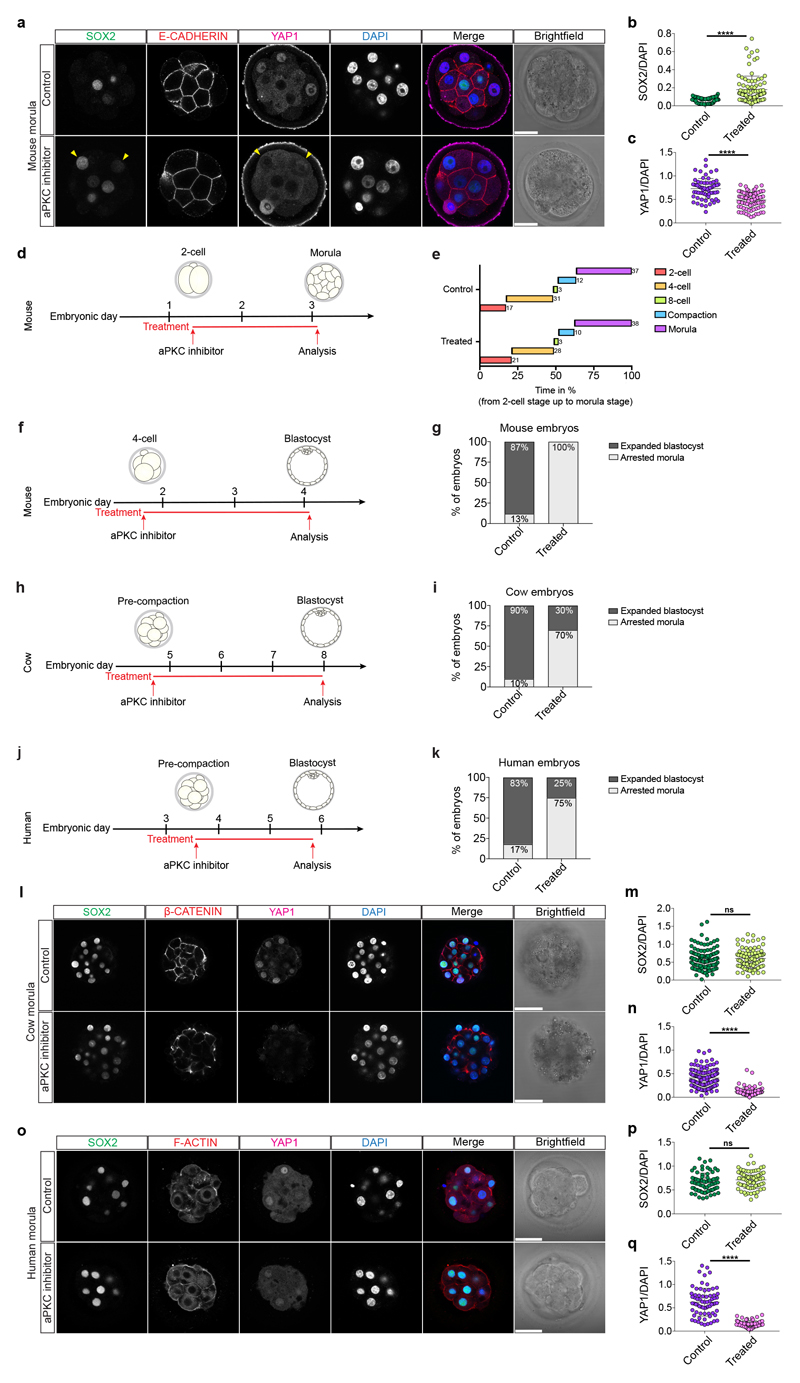
Extended Data Figure 8.
a, Immunofluorescence analysis of SOX2 (green), E-CADHERIN (red), YAP1 (magenta) and DAPI nuclear staining (blue) in control and aPKC inhibitor-treated mouse morula stage embryos. Yellow arrowheads point to outer cells expressing SOX2 in a mouse morula stage embryo. b, c, Quantification of SOX2 (b) and YAP1 (c) fluorescence intensity, normalized to DAPI intensity, in outer cells in control and aPKC-inhibitor treated mouse morula stage embryos (n = 155 cells from 19 embryos). t-test, ***p < 0.001, ****p < 0.0001. d, Schematic of aPKC inhibitor treatment in mouse embryos. e, Morphokinetic analysis of control and aPKC-treated mouse embryos showing relative time in percentage (from 2-cell stage to morula stage) (n = 88). f, Schematic of aPKC inhibitor treatment in mouse embryos. g, Quantification of percentage of mouse embryos either developing to form an expanded blastocyst or arrested morula in control (n = 30) and aPKC-inhibitor treated (n = 30) embryos. h, Schematic of aPKC inhibitor treatment in cow embryos. i, Quantification of percentage of cow embryos either developing to form an expanded blastocyst or arrested morula in control (n = 10) and aPKC-inhibitor treated (n = 10) embryos. j, Schematic of aPKC inhibitor treatment in human embryos. k, Quantification of percentage of human embryos either developing to form an expanded blastocyst or arrested morula in control (n = 12) and aPKC-inhibitor treated (n = 12) embryos. l, Immunofluorescence analysis of SOX2 (green), β-CATENIN (red), YAP1 (magenta) and DAPI nuclear staining (blue) in control and aPKC inhibitor-treated cow morula stage embryos. m, n, Quantification of SOX2 (m) and YAP1 (n) fluorescence intensity, normalized to DAPI intensity, in outer cells in control and aPKC-inhibitor treated cow morula stage embryos (n = 218 cells from 15 embryos). t-test, ****p < 0.0001, ns = not significant. o, Immunofluorescence analysis of SOX2 (green), F-ACTIN (red), YAP1 (magenta) and DAPI nuclear staining (blue) in control and aPKC inhibitor-treated human morula stage embryos. p, q, Quantification of SOX2 (p) and YAP1 (q) fluorescence intensity, normalized to DAPI intensity, in outer cells in control and aPKC-inhibitor treated cow morula stage embryos (n = 140 cells from 10 embryos). t-test, ****p < 0.0001, ns = not significant. Scale bars, as displayed in figures.

