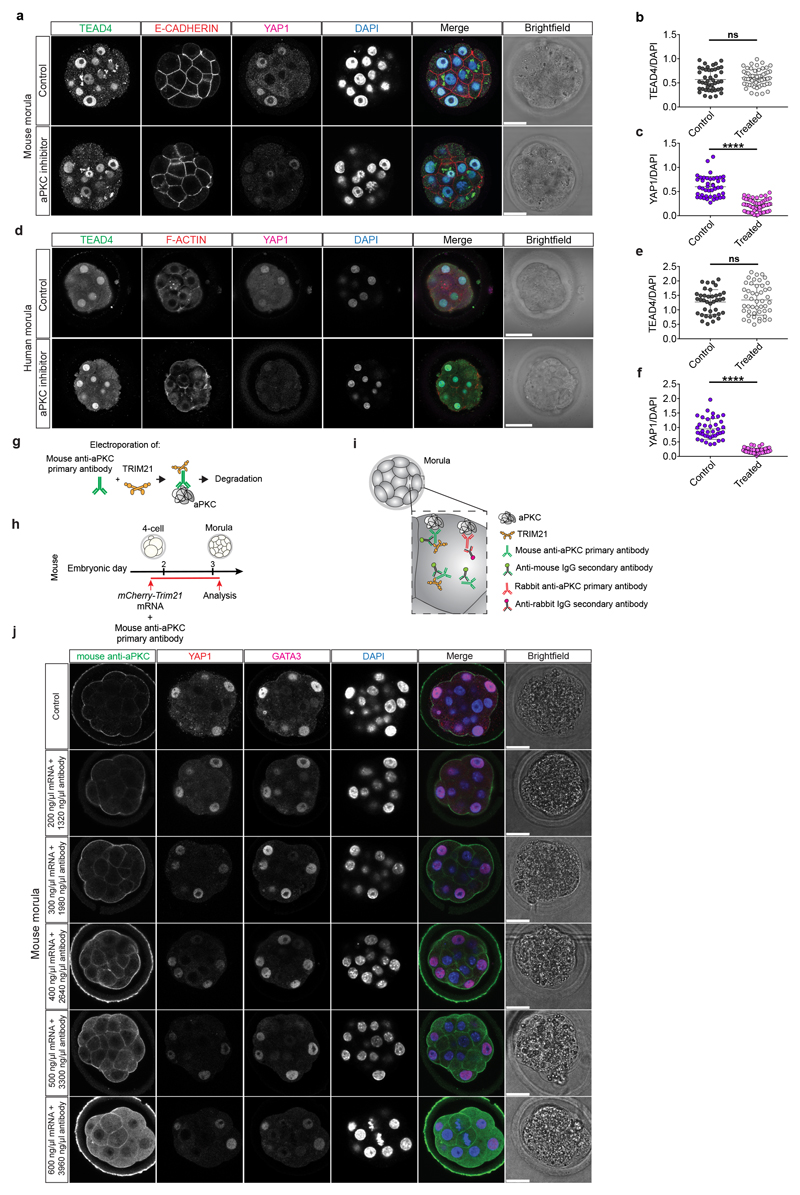
Extended Data Figure 9.
a, Immunofluorescence analysis of TEAD4 (green), E-CADHERIN (red), YAP1 (magenta) and DAPI nuclear staining (blue) in control and aPKC inhibitor-treated mouse morula stage embryos. b, c, Quantification of TEAD4 (b) and YAP1 (c) fluorescence intensity, normalized to DAPI intensity, in outer cells in control and aPKC-inhibitor treated mouse morula stage embryos (n = 101 cells from 10 embryos). t-test, ****p < 0.0001, ns = not significant. d, Immunofluorescence analysis of TEAD4 (green), F-ACTIN (red), YAP1 (magenta) and DAPI nuclear staining (blue) in control and aPKC inhibitor-treated human morula stage embryos. e, f, Quantification of TEAD4 (e) and YAP1 (f) fluorescence intensity, normalized to DAPI intensity, in outer cells in control and aPKC-inhibitor treated human morula stage embryos (n = 89 cells from 6 embryos). t-test, ****p < 0.0001, ns = not significant. g, Schematic of the TRIM-Away approach. h, Schematic representation of the TRIM-Away experiment in mouse. i, Schematic representation of the two different antibodies used in the TRIM-Away experiment. j, Immunofluorescence analysis of anti-mouse secondary antibody to detect the electroporated aPKC antibody (green), YAP1 (red), GATA3 (magenta) and DAPI nuclear staining (blue) at the morula stage in control embryos and in embryos electroporated with mCherry-TRIM21 mRNA and anti-aPKC antibody (n = reported in Supplementary Table 9 for each condition). Scale bars, as displayed in figures.

