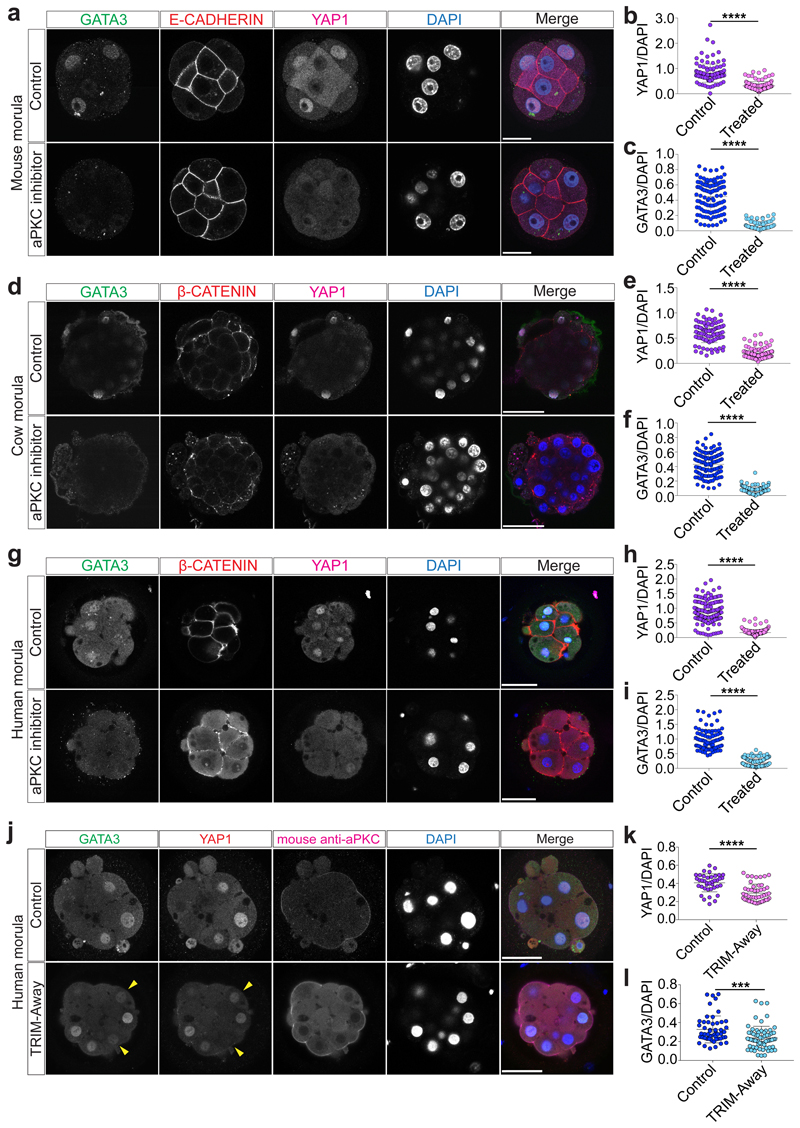
Fig. 3. aPKC activity is required for YAP1 and GATA3 expression in mouse, cow and human morula stage embryos.
a, Immunofluorescence analysis of GATA3 (green), E-CADHERIN (red), YAP1 (magenta) and DAPI nuclear staining (blue) in control and aPKC inhibitor-treated mouse morula stage embryos. b, c, Quantification of YAP1 (b) and GATA3 (c) fluorescence intensity, normalized to DAPI intensity, in outer cells in control and aPKC-inhibitor treated mouse morula stage embryos (n = 243 cells for YAP1 from 28 embryos, and n = 191 for GATA3 from 26 embryos). t-test, ****p < 0.0001. d, Immunofluorescence analysis of GATA3 (green), β-CATENIN (red), YAP1 (magenta) and DAPI nuclear staining (blue) in control and aPKC inhibitor-treated cow morula stage embryos. e, f, Quantification of YAP1 (e) and GATA3 (f) fluorescence intensity, normalized to DAPI intensity, in outer cells in control and aPKC-inhibitor treated cow morula stage embryos (n = 209 cells for YAP1 from 19 embryos, and n = 218 cells for GATA3 from 21 embryos). Mann-Whitney U test, ****p < 0.0001. g, Immunofluorescence analysis of GATA3 (green), β-CATENIN (red), YAP1 (magenta) and DAPI nuclear staining (blue) in control and aPKC inhibitor-treated human morula stage embryos. h, i, Quantification of YAP1 (h) and GATA3 (i) fluorescence intensity, normalized to DAPI intensity, in outer cells in control and aPKC-inhibitor treated human morula stage embryos (n = 406 cells for YAP1 from 37 embryos, and n = 218 cells for GATA3 from 21 embryos). Mann-Whitney U test, ****p < 0.0001. j, Immunofluorescence analysis of GATA3 (green), YAP1 (red), anti-mouse secondary antibody to detect the electroporated aPKC antibody (magenta) and DAPI nuclear staining (blue) at the morula stage in embryos electroporated either with mCherry-TRIM21 mRNA only or with mCherry-TRIM21 mRNA and mouse anti-aPKC antibody. k, l, Quantification of YAP1 (k) and GATA3 (l) fluorescence intensity, normalized to DAPI intensity, in outer cells at the morula stage in embryos electroporated either with mCherry-TRIM21 mRNA only or with mCherry-TRIM21 mRNA and mouse anti-aPKC antibody (n = 281 cells for YAP1 from 32 embryos and n = 263 cells for GATA3 from 31 embryos). t-test, **p < 0.01, ****p < 0.0001. m, Immunofluorescence analysis of GATA3 (green), YAP1 (red), anti-mouse secondary antibody to detect the electroporated aPKC antibody (magenta) and DAPI nuclear staining (blue) at the morula stage in human control embryos and embryos electroporated with mCherry-TRIM21 mRNA and mouse anti-aPKC antibody. Yellow arrowheads point to decrease YAP1 and GATA3 expression in the TRIM-Away experiment. 2 independent experiments. n, o, Quantification of YAP1 (n) and GATA3 (o) fluorescence intensity, normalized to DAPI intensity, in outer cells at the morula stage in human control embryos and embryos electroporated with mCherry-TRIM21 mRNA and mouse anti-aPKC antibody (n = 88 cells from 8 embryos for YAP1 and n = 116 cells from 11 embryos for GATA3). Mann-Whitney U test, ****p < 0.0001. Scale bars as displayed in figures.

