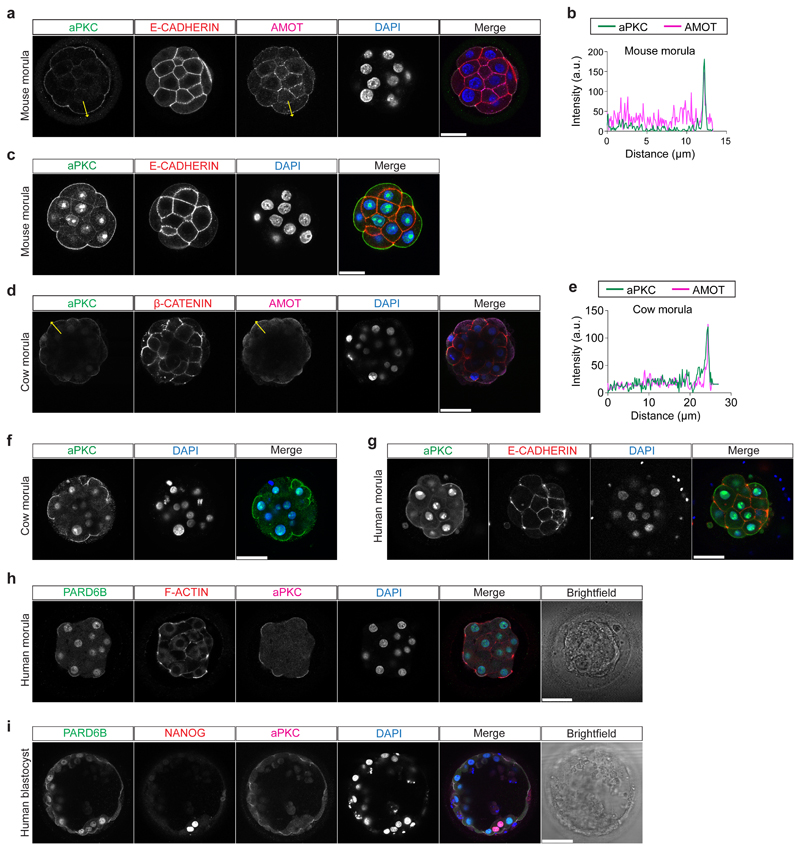
Extended Data Figure 6.
a, Immunofluorescence analysis of aPKC (green), E-CADHERIN (red), AMOT (magenta) and DAPI nuclear staining (blue) in mouse morula stage embryos (n = 10). b, Fluorescence intensity profile of aPKC and AMOT shown along the yellow arrows in mouse morula stage embryos. c, Immunofluorescence analysis of aPKC (green), E-CADHERIN (red) and DAPI nuclear staining (blue) in mouse morula stage embryo. d, Immunofluorescence analysis of aPKC (green), β-CATENIN (red), AMOT (magenta) and DAPI nuclear staining (blue) in cow morula stage embryos (n = 10). e, Fluorescence intensity profile of aPKC and AMOT shown along the yellow arrows in cow morula stage embryos. f, Immunofluorescence analysis of aPKC (green) and DAPI nuclear staining (blue) in cow morula stage embryo (n = 3). g, Immunofluorescence analysis of aPKC (green), E-CADHERIN (red) and DAPI nuclear staining (blue) in human morula stage embryo (n = 3). aPKC antibody used in this figure panel c, f, g is LC-C354069 (LSBio), while aPKC antibody used in Figure 3 and in this figure panel a, d is sc-17781 (Santa Cruz). Both antibodies show strong aPKC apical expression. h, Immunofluorescence analysis of PARD6B (green), F-ACTIN (red), aPKC (magenta) and DAPI nuclear staining (blue) in human morula stage embryo (n = 3). i, Immunofluorescence analysis of PARD6B (green), NANOG (red), aPKC (magenta) and DAPI nuclear staining (blue) in human blastocyst stage embryo (n = 3). Scale bar, as displayed in figure.

