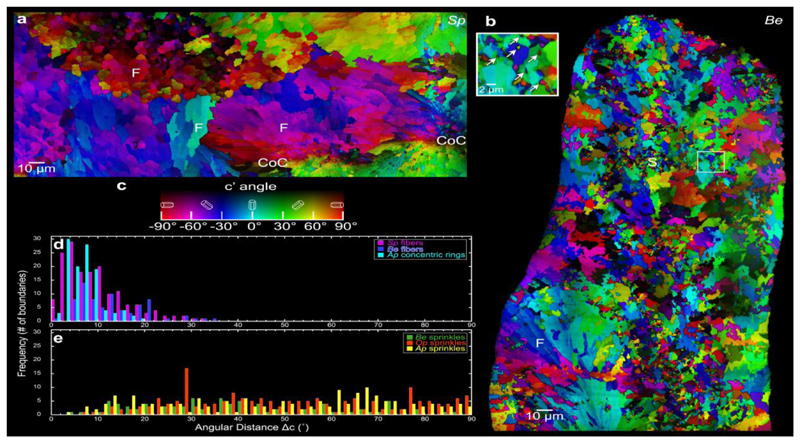
Figure 2.
Merged PIC maps of (a) Stylophora pistillata (Sp) and (b) Balanophyllia europaea (Be) coral skeletons. (c) Color bar for PIC maps in (a) and (b). Centers of calcification (CoC) extend along a non-straight line between the two CoC labels in Sp. No CoCs are visible in this particular Be region. Notice the acicular crystal fibers (F) characteristic of spherulites, changing color and thus orientation only slightly across grain boundaries, and sprinkles (S), which are smaller crystals changing color abruptly across boundaries. Sprinkles are found in the mature (bulk) skeletons of Be, but not in Sp, whereas spherulitic crystals appear in both skeletons. Inset in (b) shows a higher magnification PIC map of the sprinkles, which are indicated by the arrows and are interspersed with spherulitic crystals. (d) Distributions of angular distances between the c-axes of adjacent crystals in spherulitic crystals in Sp and Be skeletons, and in concentric rings of Acropora pharaonis (Ap) skeletons (Fig. 7). (e) Identically measured distributions in the sprinkles of Be, Oculina patagonica (Op), and Ap skeletons. Notice that in spherulitic crystals, the angular distances are always within 35°, whereas in sprinkles, they are random (0–90°). Details of the angular distance measurement and the ROI selections are described in the Experimental Methods and Figure S4.

