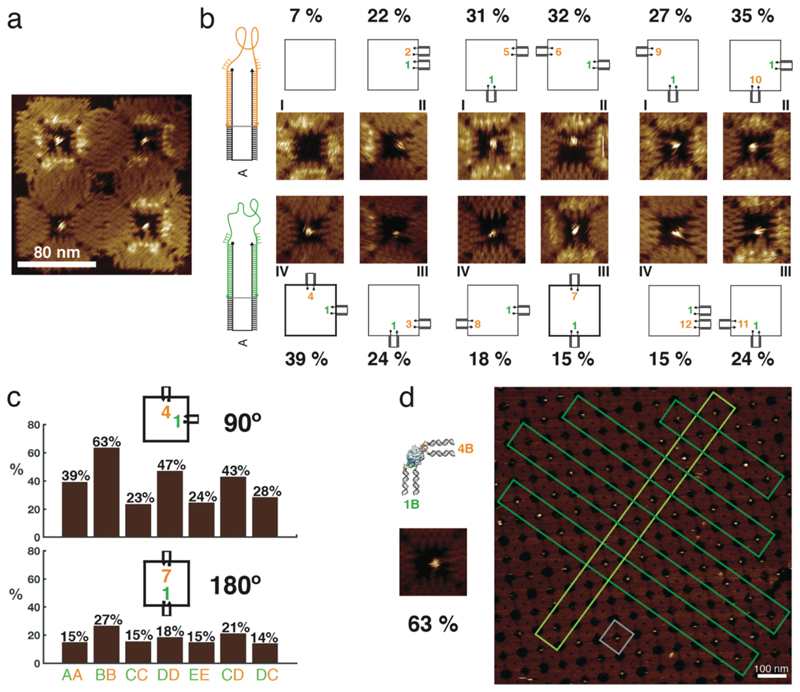
Figure 3. Binding of human thrombin to aptamers in different orientations and in lattices.
a, Example of an AFM image of a 2 x 2 array with thrombin bound in the cavities. Schemes and AFM images of the 11 different configurations of aptamers are shown. HD22 is always in position 1 and the TBA1 position varies in the cavity. All aptamers are attached as in case A. Statistical analysis shows that the 90º (1,4) configuration results in the best binding yield of these configurations. The binding assay for all the configurations was performed in one pot and imaged simultaneously. b, Yield of thrombin binding to its aptamers in 90º (1,4) and 180º (1,7) configuration. The effect of aptamer flexibility at the stem and in the vicinity of the aptamer loop for these configurations are compared. The histogram shows a comparison between the different cases – 90° (1B,4B) has the overall best yield. c, Formation of a 2D crystalline array of the DNA origami structures with the best configuration for binding to thrombin (a scheme and small AFM image of this configuration is shown on the left). The gray box highlights a single structure in the lattice and the dark and light green boxes specify linear arrangements of them within the crystal. All percentages are derived from single AFM experiments to enable direct comparison under identical conditions (n=1, therefore no error bars are given). In all experiments, thrombin and the DNA cavities were first incubated free in solution, followed by deposition and AFM characterization of the nanostructures on mica.

