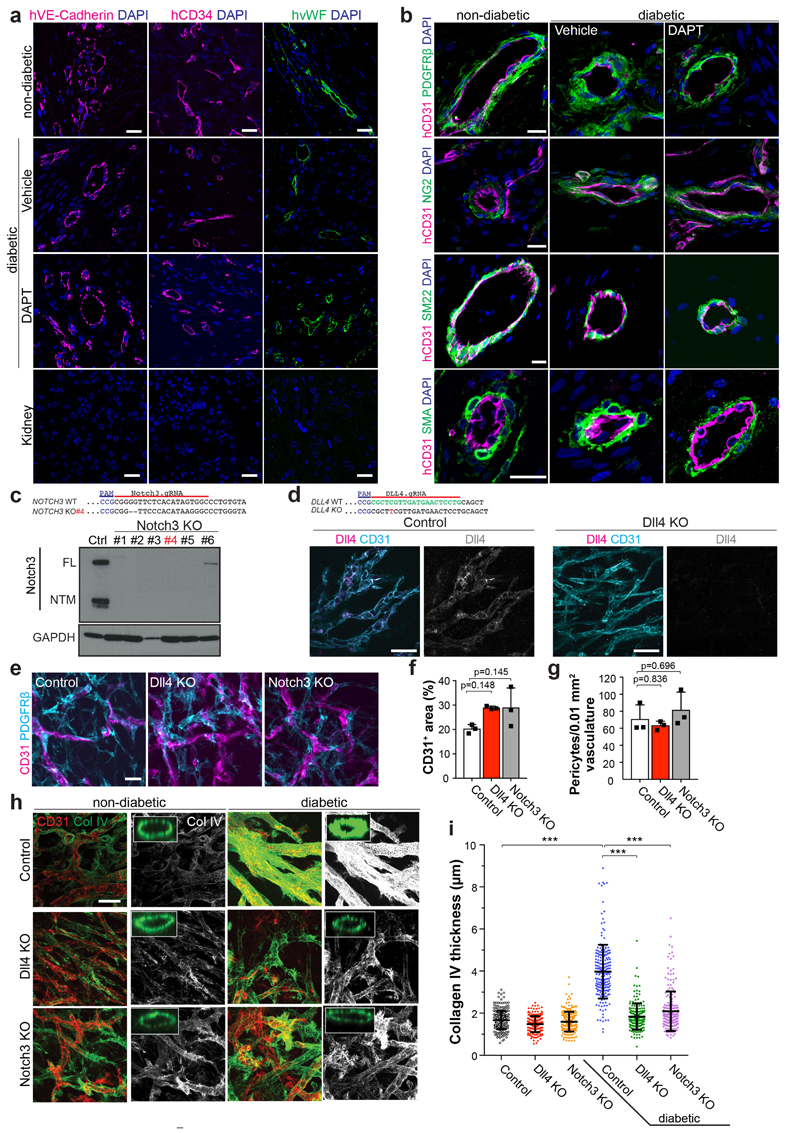
Extended Data Figure 9. DAPT treatment of vascular organoids in vivo and Dll4 and Notch3 knock out vascular organoids.
a,b, Analysis of vascular organoids transplanted into non-diabetic or diabetic STZ mice treated with vehicle or DAPT. a, Transplanted human blood vessels into diabetic STZ mice ± DAPT treatment were stained for human specific endothelial markers VE-Cadherin (hVEC), CD34 (hCD34) and vWF (hvWF). Note the absence of signal in the adjacent mouse kidney. b, Transplanted human blood vessels into diabetic STZ mice ± DAPT treatment were stained for the pericyte specific markers PDGFRβ, NG2, SM22 and SMA. Co-staining with a human specific CD31 (hCD31) antibody was used to identify human blood vessels. a,b, Experiments were repeated independently on n = 3 biological samples, with similar results. c,d, CRISPR/Cas9 genome editing was used to generate DLL4 and NOTCH3 knock out iPSCs (NC8). Single guide RNAs (sgRNAs) are indicated in the NOTCH3/DLL4 sequence as well as generated indels. c, Western blot shows ablation of Notch3 expression in target iPSCs. Clone #4 (red) was used for functional assays. FL, full length Notch3; NTM, transmembrane Notch3 subunit. d, Immunostaining in control vascular organoids shows expression of Dll4 in endothelial cells (CD31+) but not in CRISPR/Cas9 genome edited iPSCs. c,d, Experiments were repeated independently n = 2 times with similar results. e, Vascular organoids differentiated from Dll4 KO and Notch3 KO iPS cells (NC8) were stained for endothelial cells (CD31) and pericytes (PDGFRβ). Experiments were repeated independently n = 3 times with similar results. f, Quantification of endothelial networks (CD31+ area) in Dll4 KO and Notch3 KO vascular organoids. Graph represents mean ± S.D. from n=3 independent experiments. P-values are indicated in the panel (One-way ANOVA). g, Quantification of pericyte number in Dll4 KO and Notch3 KO vascular organoids. Graph represents mean ± S.D. from n=3 independent experiments. P-values are indicated in the panel (One-way ANOVA). h, Representative images of basement membranes stained for Collagen IV (Col IV) from control, Dll4 KO, and Notch3 KO vascular organoids (NC8 iPSCs) exposed to hyperglycemia/IL6/TNFα (diabetic) or maintained under standard culture conditions (non-diabetic). Experiments were repeated independently n = 3 times with similar results. i, Thickness of continuously surrounded lumina by Col IV was measured in optical cross-sections. Each individual measurement from a lumenized vessel is shown as a dot in the right panel. A total of non-diabetic (Control n=265, Dll4 KO n=203, Notch3 KO n=215) and diabetic (Control n=214, Dll4 KO n=187, Notch3 KO n= 206) lumina were analysed for each experimental condition from 3 independent biological replicates with equal sample size. Means are represented as centre bars ± SD. *** p<0.001 (One-way ANOVA). Scale bar a,b,e=20μm, d,h=50μm

