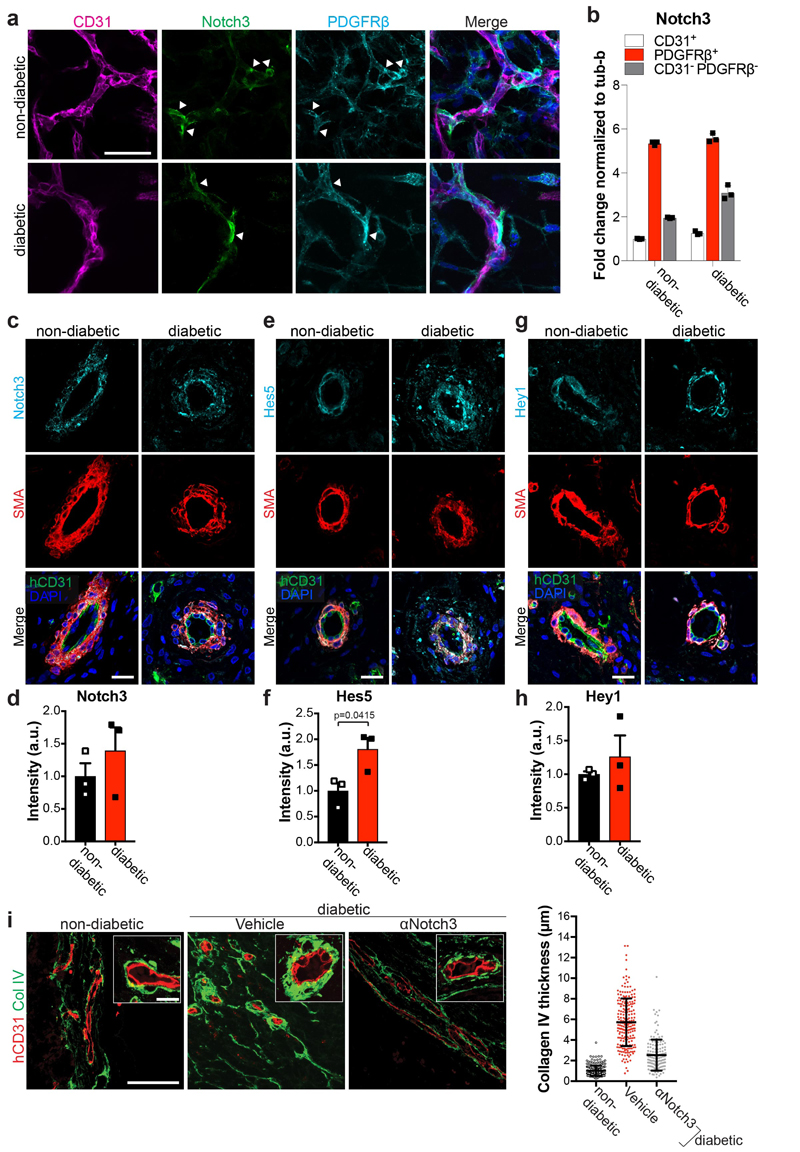
Extended Data Figure 10. Notch3 expression and signaling in vascular organoids.
a, Vascular organoids were cultured under non-diabetic or diabetic conditions and co-stained for Notch3, endothelial cells (CD31) and pericytes (PDGFRβ). Predominant localization of Notch3 in pericytes is indicated by the white arrowheads. Experiments were repeated independently n=3 times with similar results.b, RT-qPCR of endothelial cells (CD31+), pericytes (PDGFRβ+) and the remaining CD31- PDGFRβ- cells shows highest Notch3 in pericytes. Graph represents mean ± S.E.M. from 3 independent experiments. c-h, Human vascular organoids transplanted into non-diabetic control or diabetic STZ mice were analysed for Notch3 expression and the Notch downstream targets Hes5 and Hey1. Histological sections of transplanted human blood vessels were stained for c, Notch3, e, Hes5 or g, Hey1 and co-stained for SMA (pericytes) and hCD31 (human endothelium). Note the localization of Notch3, Hes5 as well as Hey1 to SMA positive pericytes. Experiments were repeated independently on n = 3 biological samples, with similar results. Quantification of d, Notch3, f, Hes5 and h, Hey1 expression. Pericytes were segmented using SMA and the intensity of immunofluorescence signal for each marker was measured. Graph represents mean ± S.E.M from n = 3 mice. P-value is indicated in the panel (two tailed student t-test). i, Diabetic mice transplanted with human vascular organoids (H9 ESCs) were treated with a Notch3 blocking antibody. Basement membrane thickness of individual human blood vessels (hCD31+) of non-diabetic n= 223, non-diabetic+Vehicle =212 and diabetic+αNotch3 n=143 was determined based on Col IV staining from n = (non-diabetic=3, diabetic + Vehicle=3, diabetic + αNotch3=2) mice. Mean is shown as centre bar ± SD. Scale bar a,c,e,g,i=50μm

