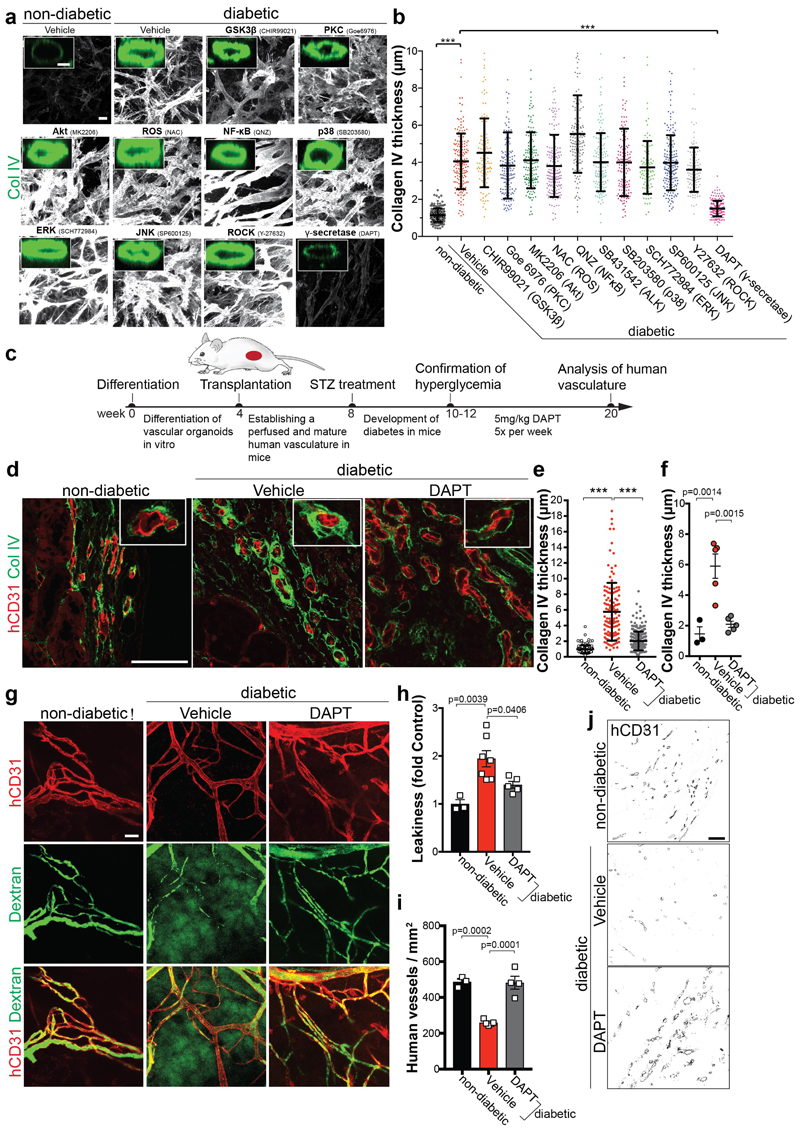
Figure 3. Inhibition of γ-secretase abrogates diabetic microvasculopathy of human blood vessel organoids.
a, Representative images of basement membranes in diabetic blood vessels (NC8) treated with small molecule inhibitors of various signaling pathways. Insets show confocal cross-sections of individual vessels surrounded by collagen type IV (Col IV). Experiments were repeated independently n=3 times with similar results. b, The thickness of the Col IV+ coat of individual vessels was measured in optical cross-sections. Non-diabetic n=171, Vehicle n=172, CHIR99021 n=110, Goe 6976 n=156, MK2206 n=165, NAC n=193, QNZ n=147, SB431542 n=151, SB203580 n=148, SCH772984 n=96, SP600125 n=183, Y27632 n=122, DAPT n=196 individal lumina were analysed from 3 independent biological replicates with equal sample size. Mean ± S.D.*** p<0.0001 (One-way ANOVA). c, Schematic of vascular organoid transplantion (H9) and treatment of mice. d, Basement membrane thickening (Col IV) around human blood vessels (hCD31) is greatly prevented by DAPT treatment. Experiments were repeated independently on n = 3 biological samples, with similar results. e, Col IV thickness of individual human blood vessels (hCD31+) in non-diabetic and STZ-induced diabetic mice ± DAPT treatment. Non-diabetic n=132, Vehicle n=131, DAPT n=271. Mean ± SD. *** p<0.0001 (One-way ANOVA). f, Means ± SD of Col IV thickness of human blood vessels (hCD31+) from individual transplants. Non-diabetic n=3, Vehicle, DAPT n=5. (One-way ANOVA). g, Vascular permeability assessed by i.v. injection of FITC-Dextran and co-staining with hCD31 to visualize the human vasculature. Note the diffuse FITC signal in the diabetic mice (Vehicle) which indicates vessel leakage. Experiments were repeated independently on n = 3 biological samples, with similar results. h, Quantification of vessel leakage determined by FITC-Dextran extravasation. Mean ± S.E.M. n= (non-diabetic=3, diabetic + Vehicle control=7, diabetic + DAPT =5) mice. (One-way ANOVA). i, Quantification of human blood vessel density in transplanted vascular organoids. Mean ± S.E.M. n= (non-diabetic=3, diabetic + Vehicle=5, diabetic + DAPT=4) mice. *** Non-diabetic vs Vehicle p=0.0002, Vehicle vs DAPT p=0.0001 (One-way ANOVA). j, Representative images of human CD31+ blood vessel density. Experiments were repeated independently on n = 3 biological samples, with similar results. Scale bars, a=20μm, a(insert)=5μm, c,f,i=50μm.

