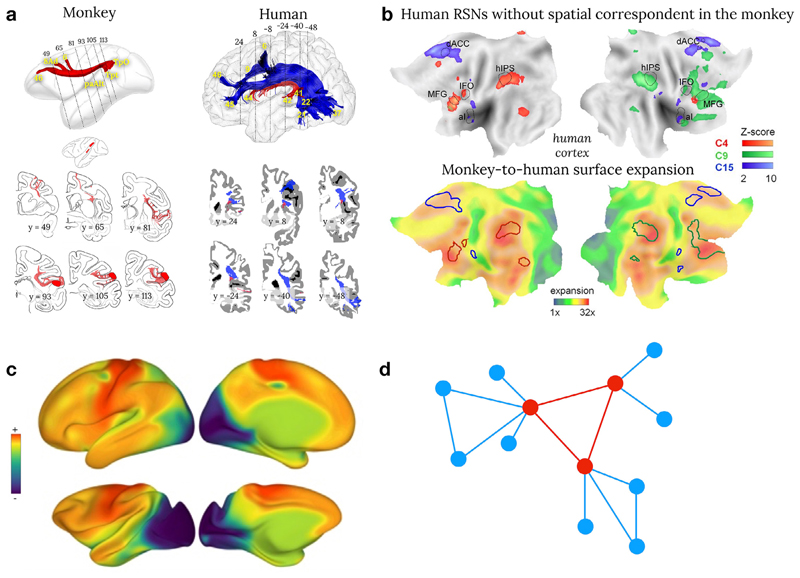
Fig 4.
Brain connectivity cross-species comparison. a) Comparison between post-mortem axonal tracing in monkeys (cases 7&9 modified from Schmahmann and Pandya, 2006) and human in vivo spherical deconvolution tractography. Common anatomical features between human and monkey are reconstructed in red whereas anatomical differences have been coloured in blue (Thiebaut de Schotten et al., 2012) b) Flat maps of the human resting state functional connectivity without correspondence with the monkey (upper row) and its correspondence to cortical expansion maps (Mantini et al., 2013) c) Preliminary comparison of the principal gradient in humans and macaques (see Brain integration section of this paper for a definition of brain gradients ; Xu et al., 2019) d) The rich club organisation of the brain where regions in red are interconnected together and a hub for regions in blue (Bullmore and Sporns 2012).

