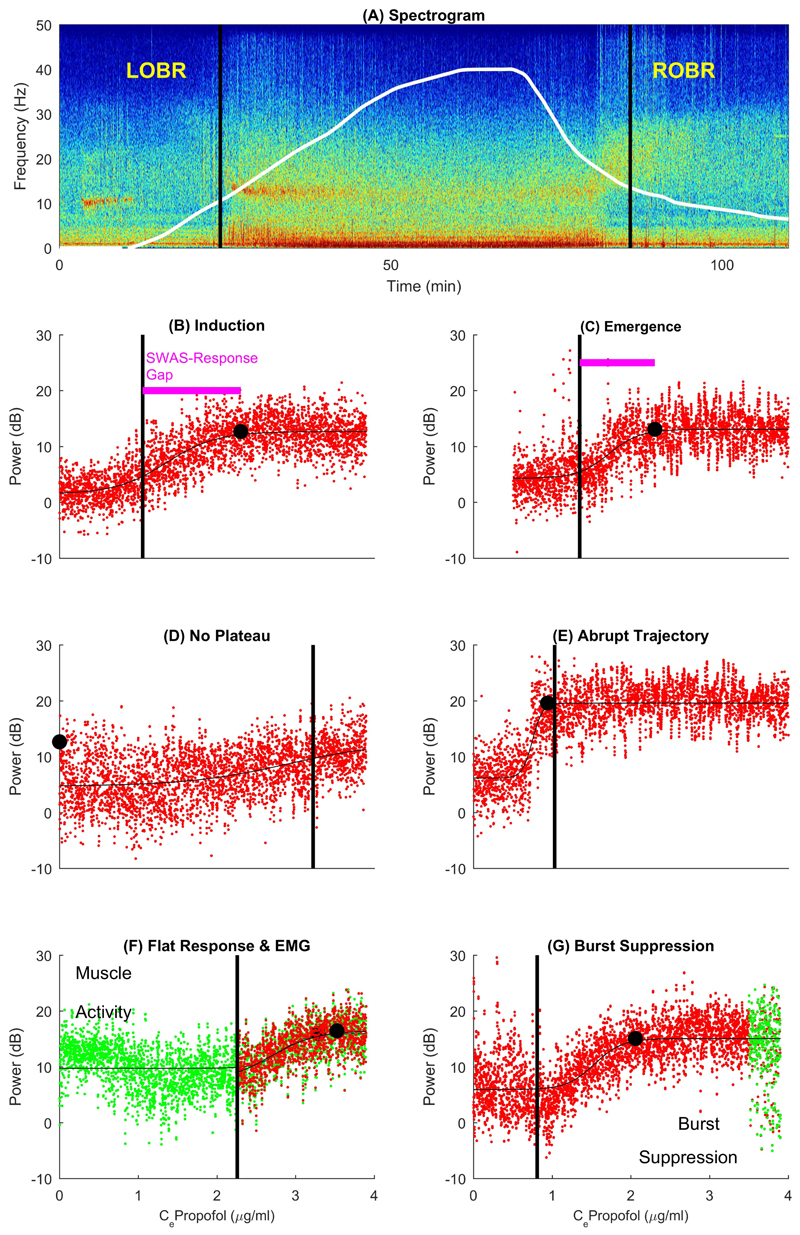
Fig. 1. Estimation of slow wave activity saturation.
(A) An individual EEG time-frequency spectrogram recorded at P7 electrode in Study1, with the propofol effect site concentration (Ce) timecourse shown in white to maximum of 4μg/ml. Corresponding slow wave activity (SWA) -anesthetic dose response curves are shown for induction (B) and emergence (C). Loss and recovery of behavioral responsiveness (L/ROBR) are shown as black vertical lines throughout. SWA data is in red, the thin black line is the sigmoid curve fit and the black dot indicates slow wave activity saturation (SWAS). Sub-figures (D)-(G) show practical issues related to SWAS estimation. Artefactual data are highlighted in green where present. (D) shows a graded pattern but ‘no plateau’, as the anesthetic dose administered was not sufficient to achieve SWAS within this individual. (E) shows an abrupt slow wave trajectory that indicates neural inertia on emergence from anesthesia. It is characterized by the persistence of saturation followed by an abrupt drop in slow wave activity coincident with ROBR, and formally defined by a small SWAS-response gap (shown as pink line). (F) and (G) show examples with electromyographic (EMG)/movement and burst suppression artefactual disturbance, respectively.

