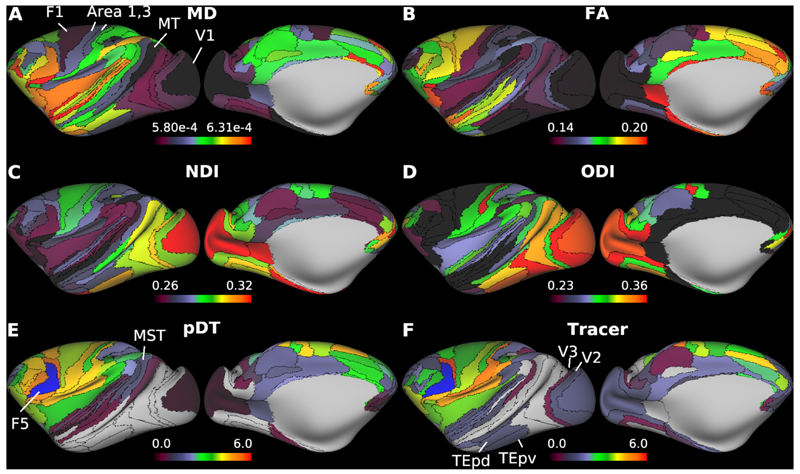
Figure 9.
Representative diffusion magnetic resonance imaging (dMRI) applications. Parcellated cortical surface distributions of mean diffusivity (MD) (A) and fractional anisotropy (FA) (B) calculated in diffusion tensor model, and neurite density index (NDI) and (C) orientation dispersion index (ODI) (D) calculated in NODDI (see main text; N=6). (E) Parcellated diffusion tractography (N=1, ID=A18031601) seed from left premotor area, F5 (blue color) and (F) the quantitative ground-truth derived from retrograde tracer injected into F5. Note the correspondence between tractography and tracer connectivities (see main text for details). Data at https://balsa.wustl.edu/zppXg

