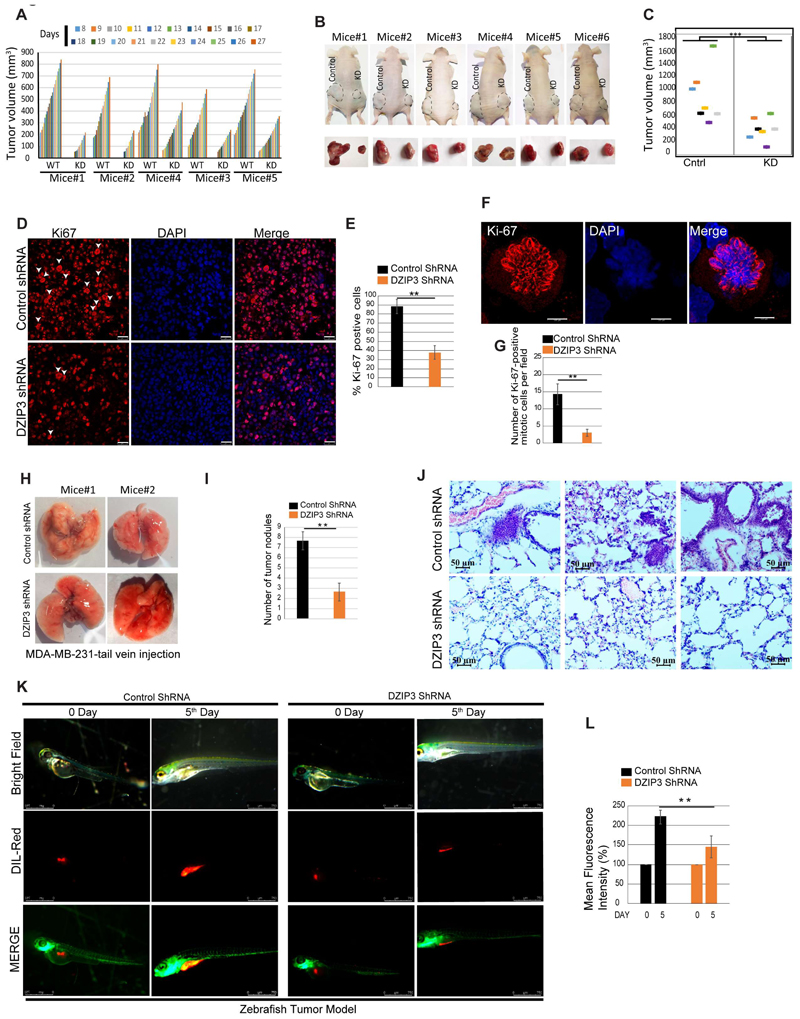
Figure 2. DZIP3 promotes tumor growth and metastasis in animal models.
(A) The graph depicts tumor volumes (mm3) of UM-UC3 control and DZIP3 stable knockdown cells.
(B) Images of tumors formed in the nude mice and pictures of the dissected tumors.
(C) The graph represents the final tumor volume. n=7, mean±SE, ***p<0.0005.
(D and E) (D) Immunohistochemical analysis was performed with the Ki-67 cell proliferation marker in control and DZIP3 stable knockdown tumor sections. (E) The graph represents % of cells with Ki-67 positive staining. >400 cells were analyzed from different sections from different animals, mean ±SD, **p < 0.005. The white arrowhead indicates the Ki-67 positive mitotic cells.
(F and G) (F) Representative images of Ki-67 positive mitotic cells. (G) The graph represents % of Ki-67 positive mitotic cells in control and DZIP3 stable knockdown tumors in IHC's microscopic fields. >10 microscopic fields were analyzed from different sections from 3 different animals, mean ±SD, **p < 0.005
(H-J) (H) Representative images of lungs of mice injected (tail-vein) with MDA-MB-231 control and DZIP3 stable knockdown cell line. (I) The average number of nodules were counted manually. n=3 mean ±SD, **p < 0.005. (J) Representative lung sections showing metastatic foci in control groups.
(K and L) (K) Lateral view of fluorescent transgenic [Tg(fli1:nEGFP)] zebrafish embryos at Day 0 and Day 5 injected with Dil-Red stained MDA-MB-231 control and DZIP3 stable knockdown cells. (L) The tumor growth was assessed by an increase in fluorescence intensity on the 5th day compared to the day of injection. n=10, mean ±SD, **p < 0.005 The quantitation of fluorescence intensity was performed using ImageJ software and represented as % mean fluorescence intensity where day 0 reading was taken as baseline.

