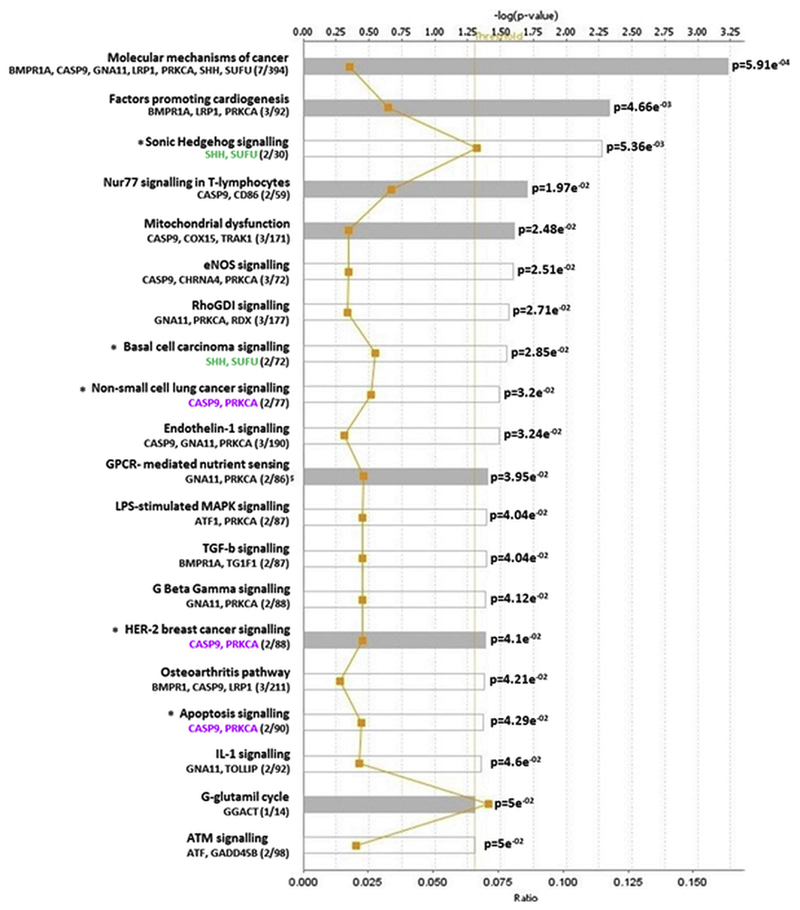
Fig. 5.
Pathway analysis of the 88 gene-associated differentially methylated CpGs. Y-axis; significant canonical pathways for the dataset. X-axis; -log (p value), calculated by Fisher’s right-tailed exact test. The ratio (orange line) is calculated as number of genes in a given pathway that meet cut-off criteria, divided by the total number of genes that make up that pathway. Threshold indicates the fraction of false positives among significant functions. Pathways that have a –log (p value) greater than the threshold of 1.3 (range 0–3.23) are displayed to the right-hand side of the graph. White bars; z-score at, or close to 0. Grey bars; pathways with no current prediction.

