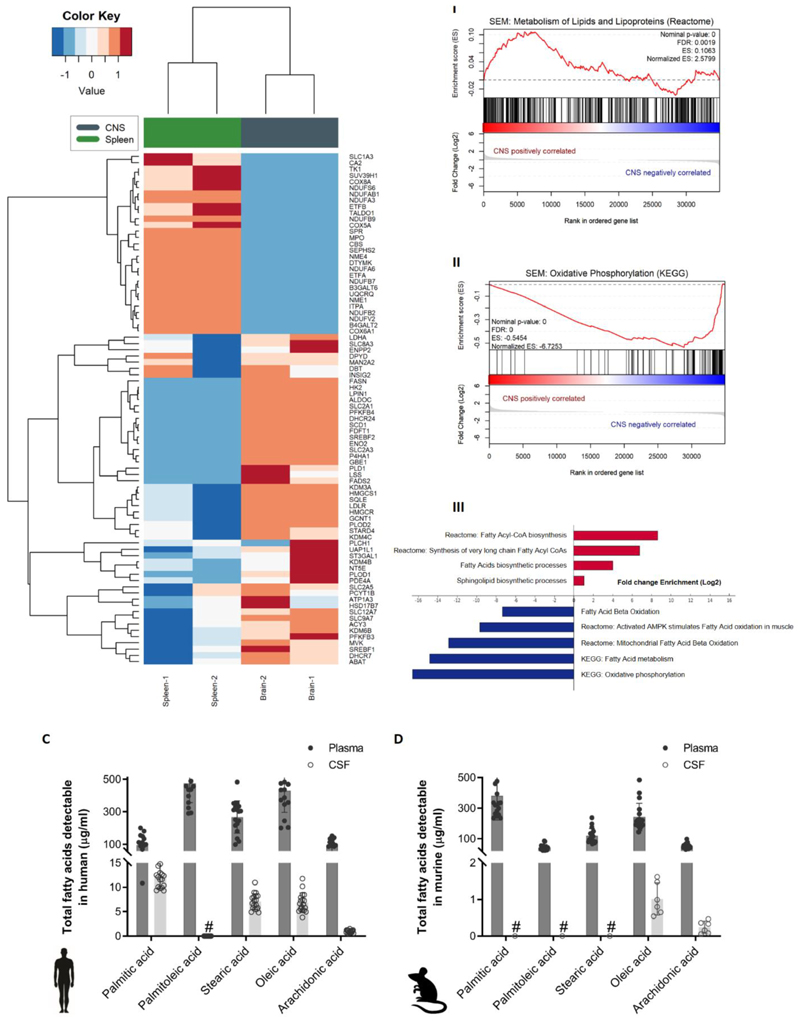
Figure 1. Fatty acid synthesis-related genes are upregulated in CNS-derived ALL cells in xenograft models.
(A) Heatmap representation of hierarchical clustering of genes differentially expressed between human SEM cells isolated from CNS and spleen of xenografted mice (n=2 independent groups of 5 mice). (B)I-II Enrichment plots of metabolism of lipids and lipoproteins (REACTOME) and oxidative phosphorylation (KEGG) for SEM cell line extracted from the CNS and spleen of xenografted mice. Profile of the running ES score & Positions of the GeneSet Members on the Rank Ordered List. III Statistically significant biological functions in SEM cells isolated from CNS and spleen of xenografted mice. Single sample GSEA scores were calculated for an array of metabolic gene signatures from MSIGDB, including KEGG, Reactome and GO term signatures. p-values for positive association with a signature (enrichment) were calculated by permutation test. Plotted are signatures with significant fold-changes in enrichment between the CNS versus spleen groups (log2 scale). Red bars indicate signatures with positive log fold-change (gain) in CNS versus spleen, blue bars indicate negative log fold-change (loss) in CNS versus spleen samples. (C) Total fatty acid levels measured by GC-MS in non-leukemic human plasma and CSF samples. n=18. Bars represent mean +/- SD. #: below detection levels. (D) Total fatty acid levels measured by GC-MS in non-leukemic murine plasma and paired CSF samples. n=9. Bars represent mean +/- SD. #: below detection levels.

