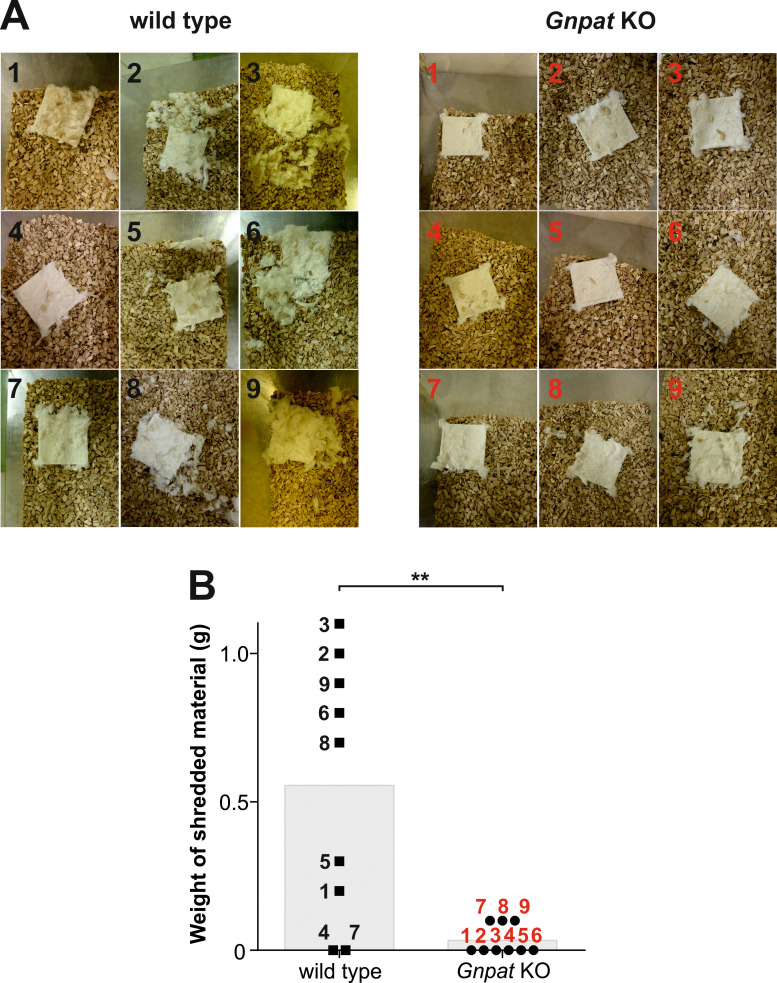
Figure 1. Nestlet shredding in a cohort of wild type and ether lipid-deficient (“Gnpat KO”) mice.
A. Nestlets after the 30 min-observation period are documented for all tested animals (n = 9 per genotype). Numbers inside the panels indicate the test ID (black: wild type; red: Gnpat KO). Note the markedly higher shredding activity of wild type compared with Gnpat KO mice. B. The difference in nestlet weight before and after the trial was calculated for each test animal and results are shown as individual data points. Grey bars indicate the mean value. Numbers next to the data points designate the mouse test ID, as defined in (A). Statistical testing was performed using Mann-Whitney U-test (**p < 0.01). The quantitative data shown here have also been presented in our previous publication ( Dorninger et al., 2019a ).

