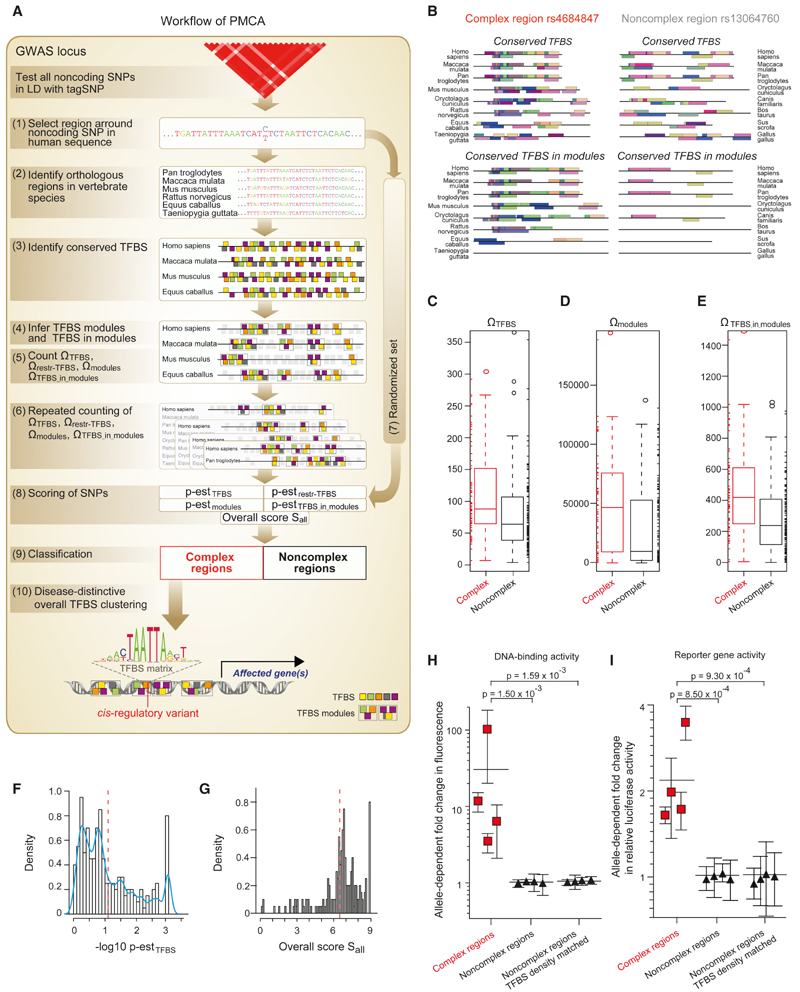
Figure 1. Discovery of cis-Regulatory Diabetes SNPs.
(A) Workflow of the PMCA methodology: (1) the flanking region of a noncoding SNP is extracted from the human reference genome; (2) orthologous regions are searched in the genomes of 15 vertebrate species; (3) TFBS are identified in each orthologous sequence; (4) TFBS modules are identified in the set of orthologous sequences (TFBS modules defined as all, two or more TFBS occurring in the same order and in certain distance range in all or a subset of the orthologous sequences); (5) phylogenetically conserved TFBS ΩTFBS, TFBS modules Ωmodules, and occurrences of TFBS in TFBS modules ΩTFBS_in_modules are counted; (6) repeated counting for different numbers of input sequences weighs the degree of cross-species conservation and the number of TFBS in modules; computation of conserved TFBS with more restricted parameters Ωrestr_TFBS accounts for genomic regions with low numbers of orthologs; (7) steps 3-6 are repeated using randomized input sequences (randomization of sequences is done using local shuffling in order to conserve local nucleotide frequency distributions) to estimate; (8) the probability p-est of observing a given ΩTFBS, Ωrestr_TFBS, Ωmodules, and ΩTFBS_in_modules and to calculate the overall scoring criterion; (9) input sequences are classified as complex and noncomplex regions; and (10) complex regions harboring a trait-related TFBS at SNP position are selected for functional evaluation (trait-related TFBS are drawn from overall TFBS clustering analysis as described in text related to Figure 3). See also the Extended Experimental Procedures.
(B) Representative complex region (rs4684847) and noncomplex region (rs13064760). Conserved TFBS and conserved TFBS in modules occurring in more than two vertebrate species are shown to illustrate TFBS modularity across species.
(C-G) Classification of SNP regions for a set of eight T2D risk loci (Table S1; Figure S1). Box-whisker plots (IQR 50%) show the counts of conserved TFBS ΩTFBS (C), conserved TFBS modules Ωmodules (D) and occurrences of TFBS in TFBS modules ΩTFBS_in_modules (E) for complex regions (red lines) and noncomplex regions (black lines). Data points covered by the interquartile range (IQR) and the whiskers values were added as rug at the sides of the plot. Note that values vary over a large range with higher median for complex regions for all criteria (at 47 T2D loci we find a median of 354.5/470.46 and 310/382.35 for ΩTFBS_in_modules in complex/noncomplex regions). Scoring of SNP regions is illustrated by histograms showing the probability p-est of observing ΩTFBS across species (F) and showing the overall scoring criterion Sall (G). Blue curve: empirical density function of the histogram data. Red dashed line: cut-off scores separating complex from noncomplex regions (— log10 p-estTFBS = 1.12, Sall = 6.5); SNP regions with a value to the left of the red line were defined as noncomplex.
(H and I) cis-Regulatory activity of SNP regions. Noncomplex regions include regions matched for TFBS density of complex regions (TFBS median = 88). The allele-dependent change in DNA-binding activity from EMSAs (n = 4) (H) and luciferase reporter activity (n = 10) (I) is shown for each SNP. Mean ± SD, p from linear mixed-effects model.

