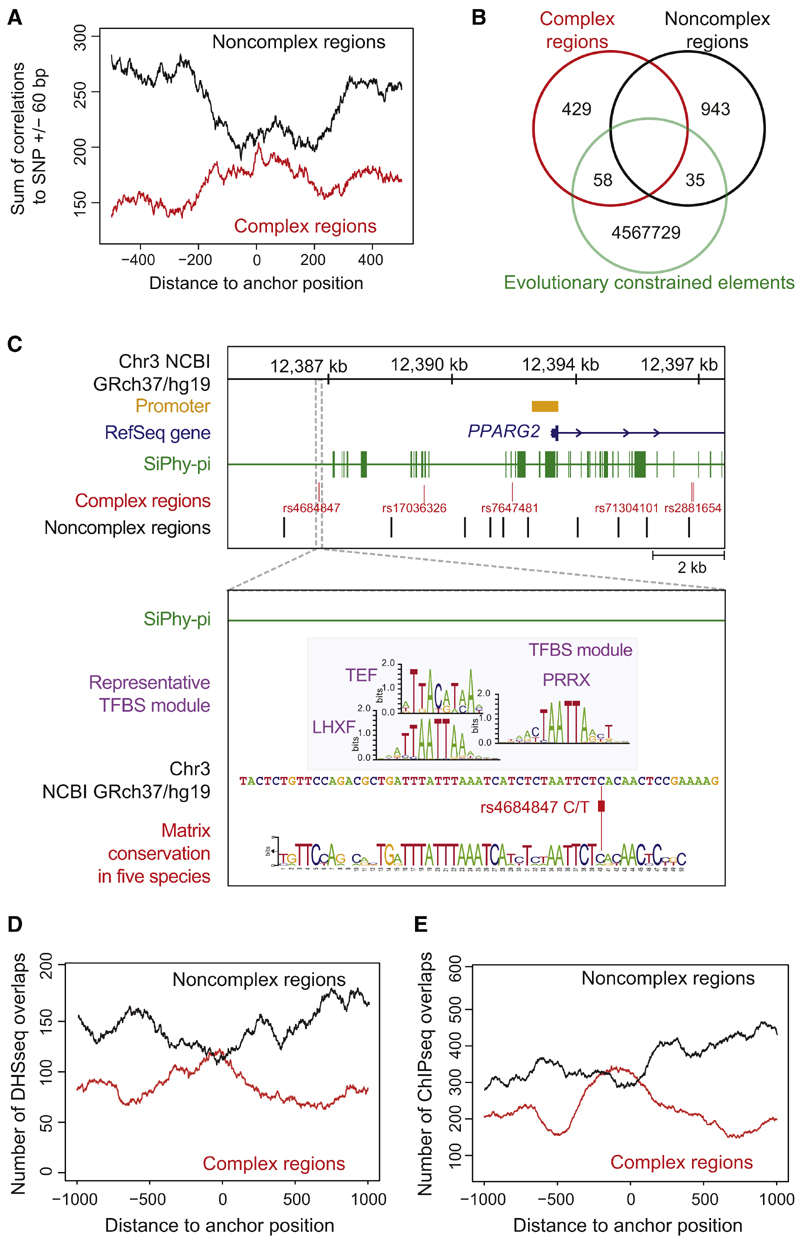
Figure 2. Correlations of cis-Regulatory Predictions at 47 T2D Risk Loci with Evolutionary Constrained Elements and Functionally Annotated Genomic Regions.
(A) Correlation of PMCA results with evolutionary constrained regions. The occurrences of 487 complex and 978 noncomplex T2D-associated regions within constrained regions from SiPhy-p algorithm (Lindblad-Toh et al., 2011). Localization of SNPs relative to transcription start site in Figures S2A and S2B.
(B) Venn diagram illustrates the number of complex and noncomplex regions that directly map to a constrained element (overlap).
(C) Complex regions at the PPARG locus (Figure 4E) lack an overlap with constrained regions. Zoom-in: the rs4684847 cis-regulatory region does not map to a constrained region (393 bp upstream of nearest constrained element). A representative TFBS module (UTFBS_in_module = 3) is shown and its TFBS module conservation for a given quorum of five species is visualized by a sequence logo.
(D and E) Correlation of complex (red line) and noncomplex (black line) T2D-associated SNP regions to DHSseq (D) and ChIP-seq (E) peaks. From the midpoint of 487 complex and 978 noncomplex regions, 1,000 bp in both directions were scanned for DHSseq and ChIP-seq peaks (Extended Experimental Procedure). For each position, the sum of occurrences was plotted. T2D complex regions were significantly enriched for overlaps with DHSseq and ChIP-seq regions, displayed as a central peak (correlations with Crohn’s-associ-ated regions in Figures S2C and S2D).

